
Endong Wang, Beien Zhu, Yi Gao. Discontinuous transition between Zundel and Eigen for
- Chinese Physics B
- Vol. 29, Issue 8, (2020)
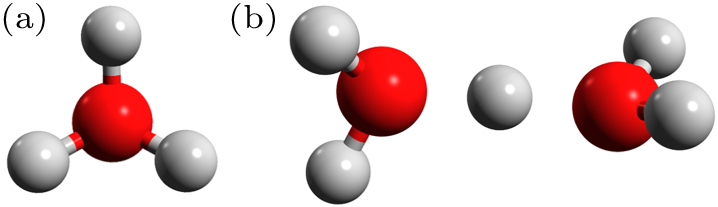
Fig. 1. The structures of (a) Eigen and (b) Zundel. Red: O atom; grey: H atom.
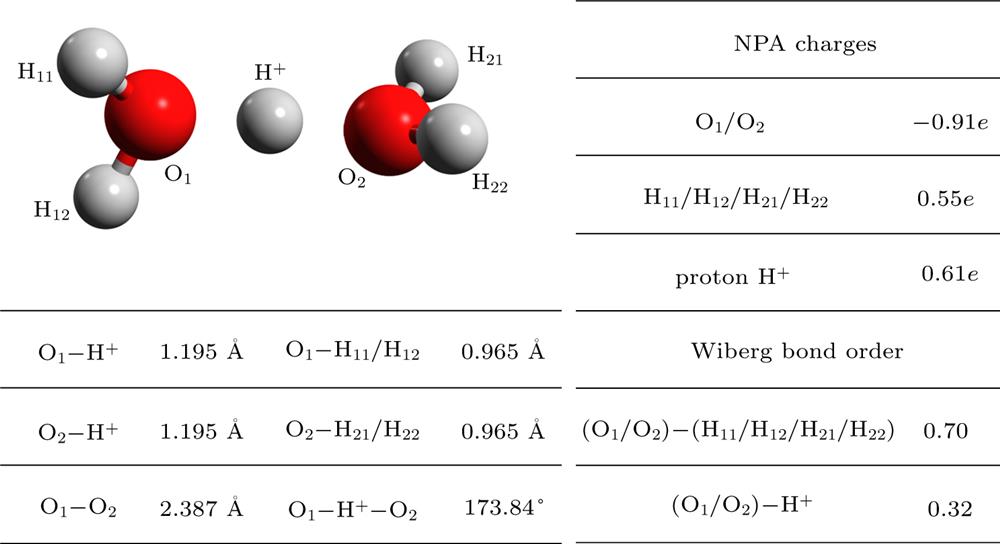
Fig. 2. Optimized H 5 O 2 +
Fig. 3. (a) Deviations of key bond lengths between those of different methods and those of CCSD(T)-F12/cc-pVTZ. (b) Proton stretch absorption band from experimental results and results of different methods.
Fig. 4. PES calculated through varying the O1–O2 and O1–H+ distances of the optimized H 5 O 2 +
Fig. 5. (a) Absorption band of the proton stretch of optimized H 5 O 2 +

Set citation alerts for the article
Please enter your email address
© Copyright 2018-2021 | Chinese Laser Press. All Rights Reserved 沪ICP备15018463号-20