• Chinese Optics Letters
  • Vol. 14, Issue 12, 120901 (2016)
Michal Makowski1、*, Tomoyoshi Shimobaba2, and Tomoyoshi Ito2
Author Affiliations
  • 1Warsaw University of Technology, Faculty of Physics, Warsaw 00-662, Poland
  • 2Graduate School of Engineering, Chiba University, 1-33 Yayoi-cho, Inage-ku, Chiba 263-8522, Japan
  • show less
    DOI: 10.3788/COL201614.120901 Cite this Article Set citation alerts
    Michal Makowski, Tomoyoshi Shimobaba, Tomoyoshi Ito. Increased depth of focus in random-phase-free holographic projection[J]. Chinese Optics Letters, 2016, 14(12): 120901 Copy Citation Text show less
    Geometric setup of the CGH calculation using the RPF method.
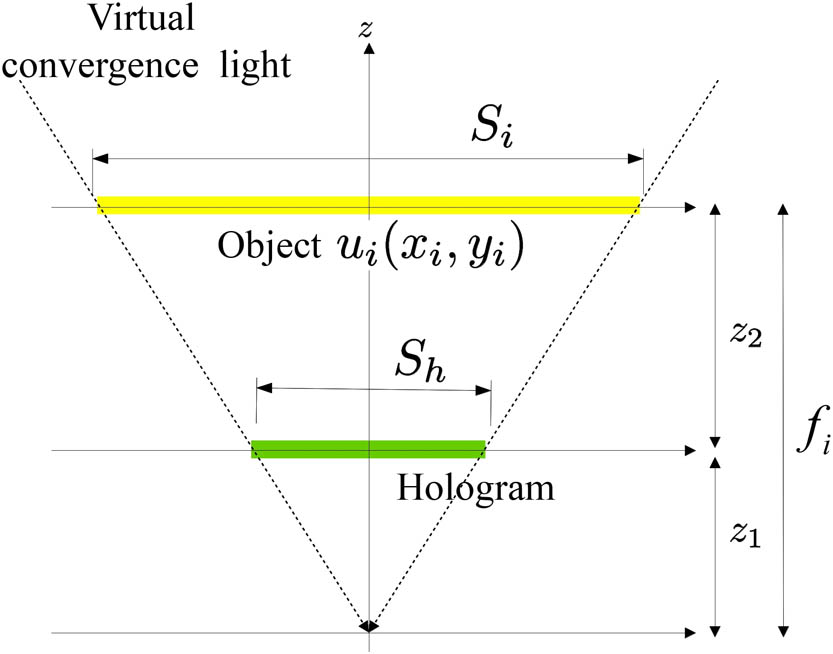
    Fig. 1. Geometric setup of the CGH calculation using the RPF method.
    Magnified parts of CGHs computed with GS algorithm (left) and RPF method (right).
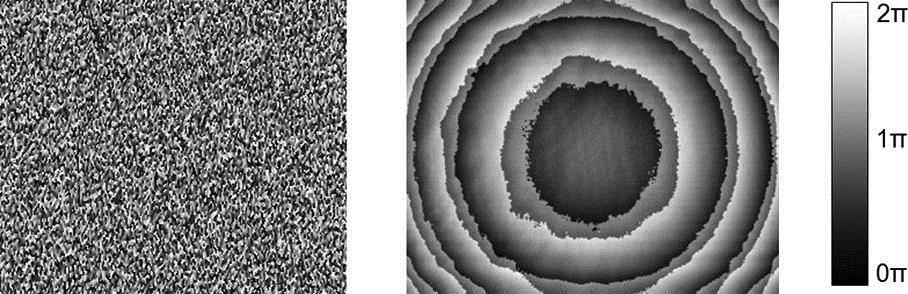
    Fig. 2. Magnified parts of CGHs computed with GS algorithm (left) and RPF method (right).
    Experimental projections of a test image on a projection screen with the GS method (left) and the RPF method (right).
    Fig. 3. Experimental projections of a test image on a projection screen with the GS method (left) and the RPF method (right).
    Optical setup for the measurement of the depth of focus in a holographic projection: (a) He–Ne laser, (b) pinhole, (c) lens, (d) mirror, (e) 50–50 non-polarizing beam splitter, (f) SLM, (g) zero-order light, (h) screen (a revolving diffuser), (i) digital camera, and (j) moving carrier stage.
    Fig. 4. Optical setup for the measurement of the depth of focus in a holographic projection: (a) He–Ne laser, (b) pinhole, (c) lens, (d) mirror, (e) 50–50 non-polarizing beam splitter, (f) SLM, (g) zero-order light, (h) screen (a revolving diffuser), (i) digital camera, and (j) moving carrier stage.
    Shallow depth of focus in diffuse-type computer hologram computed with GS method (top) and increased depth of focus in an RPF hologram (bottom). The circles on the SLM mark the size of the effective aperture.
    Fig. 5. Shallow depth of focus in diffuse-type computer hologram computed with GS method (top) and increased depth of focus in an RPF hologram (bottom). The circles on the SLM mark the size of the effective aperture.
    Experimental comparison of the defocused holographic images obtained with GS and RPF methods (USAF 1951 test pattern).
    Fig. 6. Experimental comparison of the defocused holographic images obtained with GS and RPF methods (USAF 1951 test pattern).
    Experimental comparison of the depth of focus in the GS and RPF methods (Lena).
    Fig. 7. Experimental comparison of the depth of focus in the GS and RPF methods (Lena).
    Smallest resolved group of the USAF test pattern as a function of defocusing at a base distance of 1000 mm for the GS and RPF methods.
    Fig. 8. Smallest resolved group of the USAF test pattern as a function of defocusing at a base distance of 1000 mm for the GS and RPF methods.
    Experimental 10%–90% edge response as a function of defocusing at a base distance of 1000 mm for the GS and RPF methods. Dashed and solid lines are fittings with quadratic functions. The inset shows the vertical and horizontal edges taken for the test (green).
    Fig. 9. Experimental 10%–90% edge response as a function of defocusing at a base distance of 1000 mm for the GS and RPF methods. Dashed and solid lines are fittings with quadratic functions. The inset shows the vertical and horizontal edges taken for the test (green).
    Problematic assessment of the edge response in the presence of holographic noise (upper). Exemplary cross-section is shown along the green line (bottom).
    Fig. 10. Problematic assessment of the edge response in the presence of holographic noise (upper). Exemplary cross-section is shown along the green line (bottom).
    Introduction of an obstruction (marked in the upper row) to the SLM plane causes a shadow in the RPF case.
    Fig. 11. Introduction of an obstruction (marked in the upper row) to the SLM plane causes a shadow in the RPF case.
    Numerical simulation of the shadow caused by the obstruction of half of the SLM area. A magnified zone of the intensity decay is shown in the blue frame.
    Fig. 12. Numerical simulation of the shadow caused by the obstruction of half of the SLM area. A magnified zone of the intensity decay is shown in the blue frame.
    Simulated loss of image points from an obstruction in the SLM plane.
    Fig. 13. Simulated loss of image points from an obstruction in the SLM plane.
    Michal Makowski, Tomoyoshi Shimobaba, Tomoyoshi Ito. Increased depth of focus in random-phase-free holographic projection[J]. Chinese Optics Letters, 2016, 14(12): 120901
    Download Citation