
Siyu Chen, Yelin Xia, Xingyu Liu, Jianbo Lei, Tao Wang. Microstructure and Wear Resistance of Tungsten-Carbide-Reinforced Nickel Copper Alloy Deposited by Circular Oscillating Laser[J]. Chinese Journal of Lasers, 2023, 50(20): 2002103
- Chinese Journal of Lasers
- Vol. 50, Issue 20, 2002103 (2023)
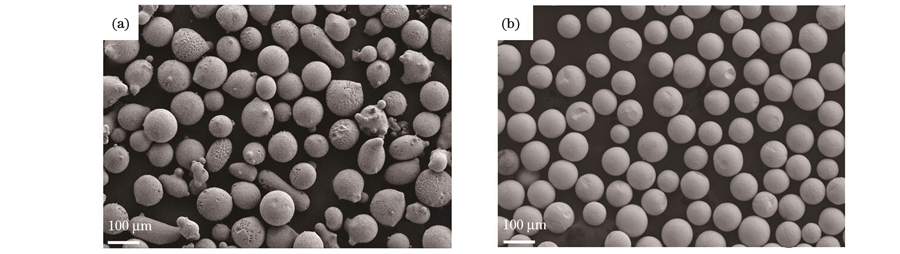
Fig. 1. Powder morphologies. (a) NiCu; (b) WC
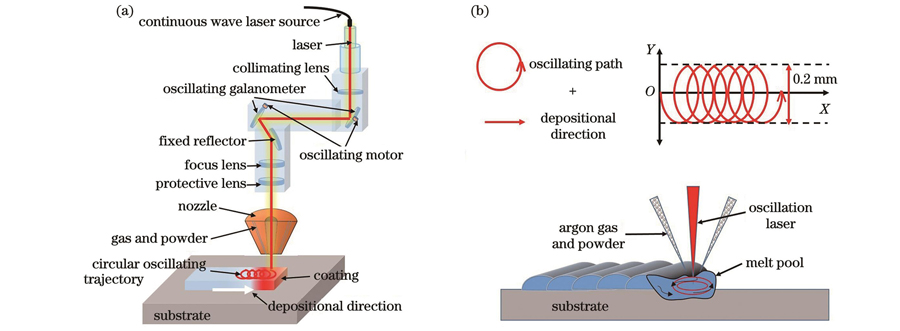
Fig. 2. Schematics of DED of circular oscillation laser. (a) Schematic of equipment; (b) oscillation trajectory and deposition process
Fig. 3. Schematic of test process
Fig. 4. XRD patterns of NiCu and NiCu/30%WC composites
Fig. 5. Macro-morphologies of deposition layers. (a) NiCu; (b) NiCu/30%WC composites
Fig. 6. Microstructures of two types of deposition layers. (a) Upper NiCu; (b) central NiCu; (c) lower part of NiCu; (d) upper NiCu/30%WC; (e) central NiCu/30%WC; (f) lower part of NiCu/30%WC
Fig. 7. Comparison of grain sizes of NiCu and NiCu/30%WC composites. (a) Microstructure of NiCu; (b) grain size of NiCu; (c) microstructure of NiCu/30%WC; (d) grain size of NiCu/30%WC
Fig. 8. Crystallization diagrams of NiCu and NiCu/30%WC composites. (a) NiCu; (b) NiCu/30%WC
Fig. 9. EDS scanning results of WC particles. (a) Line scanning result; (b) surface scanning result; (c) Ni element distribution; (d) W element distribution; (e) C element distribution; (f) Cu element distribution
Fig. 10. EDS point scanning areas
Fig. 11. Comparison of microhardness
Fig. 12. Friction and wear test results of NiCu and NiCu/30%WC composites. (a) Friction coefficient curves; (b) mass loss; (c) two-dimensional morphologies of wear scars; (d) three-dimensional morphologies of wear scars
Fig. 13. SEM images of worn surfaces. (a) NiCu; (b) NiCu/30%WC composite
Fig. 14. Wear mechanisms of NiCu and NiCu/30%WC composites
|
Table 1. Chemical compositions of NiCu and WC powders (mass fraction, %)
|
Table 2. Optimum process parameters
|
Table 3. Parameters for residual stress test
| |||||||||||||||||||||||||||||||||||
Table 4. Element compositions and mass fractions obtained by EDS scanning at different positions in Fig. 10

Set citation alerts for the article
Please enter your email address
© Copyright 2018-2021 | Chinese Laser Press. All Rights Reserved 沪ICP备15018463号-20