• Acta Photonica Sinica
  • Vol. 53, Issue 2, 0223001 (2024)
Gang JING1, Zhi LIU2、*, Peng LIN2, Shutong LIU3, and Qingfang JIANG3
Author Affiliations
  • 1School of Optoelectronic Engineering,Changchun University of Science and Technology,Changchun 130022,China
  • 2National and Local Joint Engineering Research Center of Space Optoelectronic Technology,Changchun University of Science and Technology,Changchun 130022,China
  • 3School of Electronic Information Engineering,Changchun University of Science and Technology,Changchun 130022,China
  • show less
    DOI: 10.3788/gzxb20245302.0223001 Cite this Article
    Gang JING, Zhi LIU, Peng LIN, Shutong LIU, Qingfang JIANG. Boundary Layer Effect Simulation Based on Liquid Crystal Spatial Light Modulator[J]. Acta Photonica Sinica, 2024, 53(2): 0223001 Copy Citation Text show less
    Boundary layer focusing effect diagram
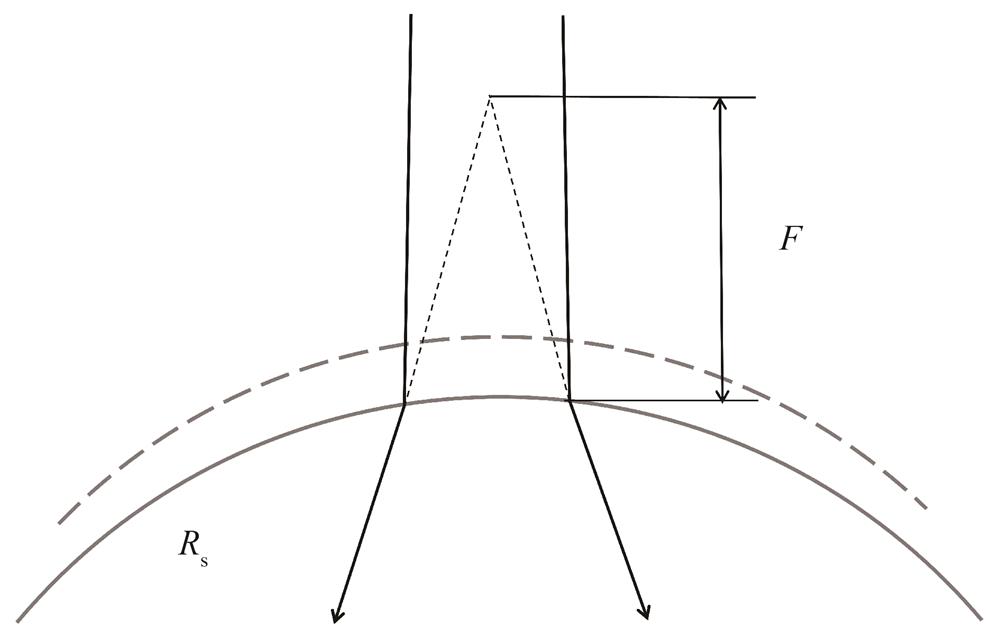
    Fig. 1. Boundary layer focusing effect diagram
    Schematic diagram of the method for measuring the actual focal length
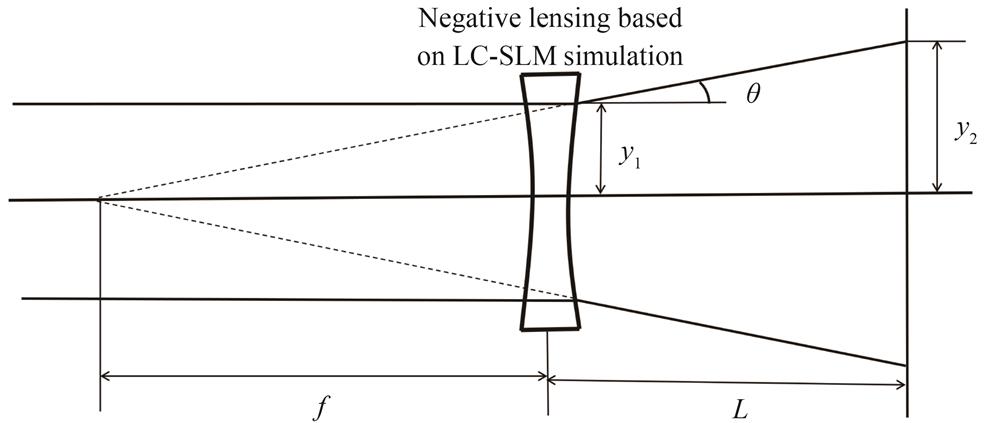
    Fig. 2. Schematic diagram of the method for measuring the actual focal length
    The relationship between flight Mach number and the equivalent focal length of the boundary layer as a negative lens
    Fig. 3. The relationship between flight Mach number and the equivalent focal length of the boundary layer as a negative lens
    The relationship between flight altitude and the equivalent focal length of the boundary layer as a negative lens
    Fig. 4. The relationship between flight altitude and the equivalent focal length of the boundary layer as a negative lens
    Schematic diagram of boundary layer effect simulator based on liquid spatial light modulator
    Fig. 5. Schematic diagram of boundary layer effect simulator based on liquid spatial light modulator
    Experimental diagram of performance verification of a spatial light modulator simulating boundary layer effects
    Fig. 6. Experimental diagram of performance verification of a spatial light modulator simulating boundary layer effects
    The phase distribution gray scale and the light spot received by the camera
    Fig. 7. The phase distribution gray scale and the light spot received by the camera
    The original laser spot image and energy distribution before pretreatment
    Fig. 8. The original laser spot image and energy distribution before pretreatment
    Spot image and energy distribution after grayscale adjustment and median filtering
    Fig. 9. Spot image and energy distribution after grayscale adjustment and median filtering
    Hough transform circle fitting flow chart of spot radius
    Fig. 10. Hough transform circle fitting flow chart of spot radius
    Curve of theoretical and experimental effects of boundary layer effect simulation under different flight states
    Fig. 11. Curve of theoretical and experimental effects of boundary layer effect simulation under different flight states
    Boundary layer simulation error curve based on spatial light modulator
    Fig. 12. Boundary layer simulation error curve based on spatial light modulator
    Output power/mWPixel countPixel size/μmAperture/mmRefresh rate/Hz
    0~201 920×1 1529.2×9.217.7×10.631
    Table 1. LC-SLM performance parameters
    ResolutionImage size/μmSpectral range/nm
    640×51225×25900~1 700
    Table 2. Camera performance parameters
    Serial numberFlight speed/MaAltitude/kmTheoretical calculation of spot radius/mmActual spot radius/mm
    11Sea level1.031 4570.968 75
    2150.878 9860.855
    31100.765 3130.787 5
    41200.638 0970.656 25
    51150.681 3410.700 25
    60.550.682 5260.703 25
    70.5200.612 2380.644 5
    80.3200.605 3750.62
    90.2100.609 4130.638
    100.2150.605 2710.618 75
    110.2Sea level0.622 0730.637 5
    Table 3. Comparison of theoretical and experimental results of boundary layer effect simulation under different flight states
    Gang JING, Zhi LIU, Peng LIN, Shutong LIU, Qingfang JIANG. Boundary Layer Effect Simulation Based on Liquid Crystal Spatial Light Modulator[J]. Acta Photonica Sinica, 2024, 53(2): 0223001
    Download Citation