• Geographical Research
  • Vol. 39, Issue 9, 1987 (2020)
Jing CAO1、2 and Wenzhong ZHANG1、2、*
Author Affiliations
  • 1Institute of Geographic Sciences and Natural Resources Research, CAS, Beijing 100101, China
  • 2University of Chinese Academy of Sciences, Beijing 100049, China
  • show less
    DOI: 10.11821/dlyj020200439 Cite this Article
    Jing CAO, Wenzhong ZHANG. The influence of urban innovation input on green economy efficiency in different periods: A case study of the Guangdong-Hong Kong-Macao Greater Bay Area[J]. Geographical Research, 2020, 39(9): 1987 Copy Citation Text show less
    The scope of the Guangdong-Hong Kong-Macao Greater Bay Area
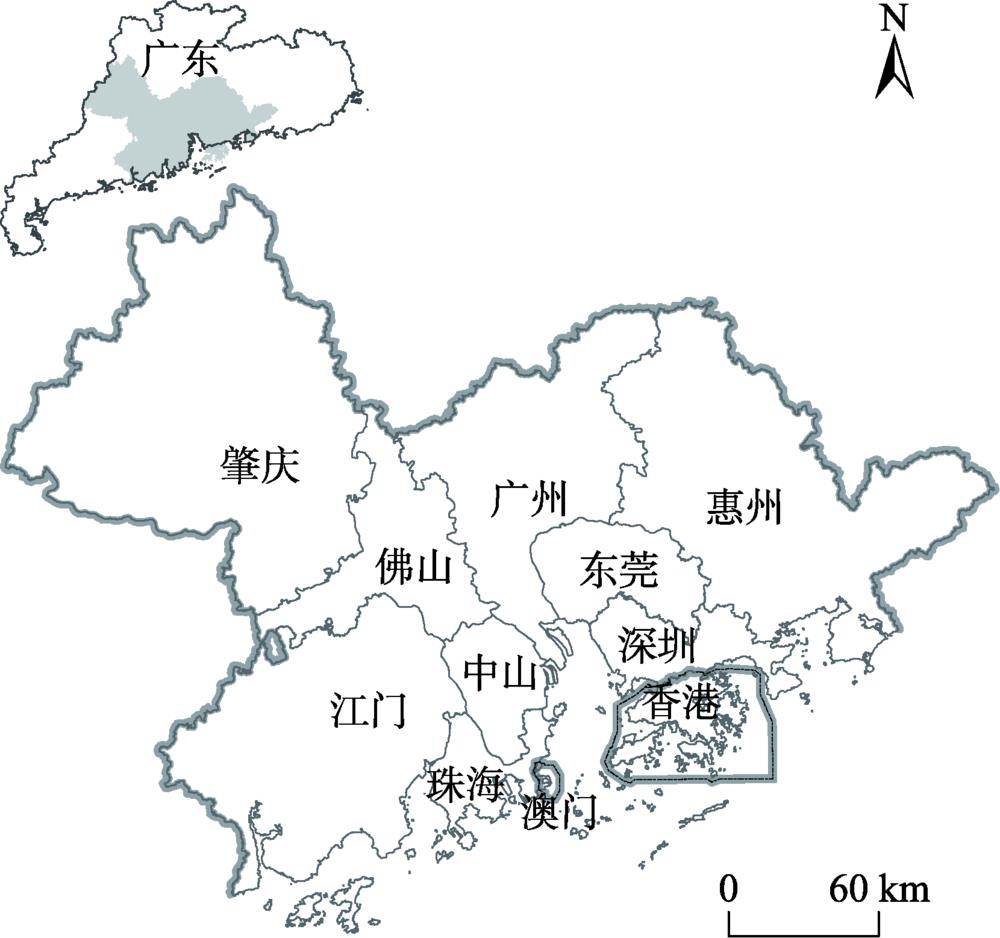
    Fig. 1. The scope of the Guangdong-Hong Kong-Macao Greater Bay Area
    Innovation input intensity values of cities in the Guangdong-Hong Kong-Macau Greater Bay Area from 2000 to 2017
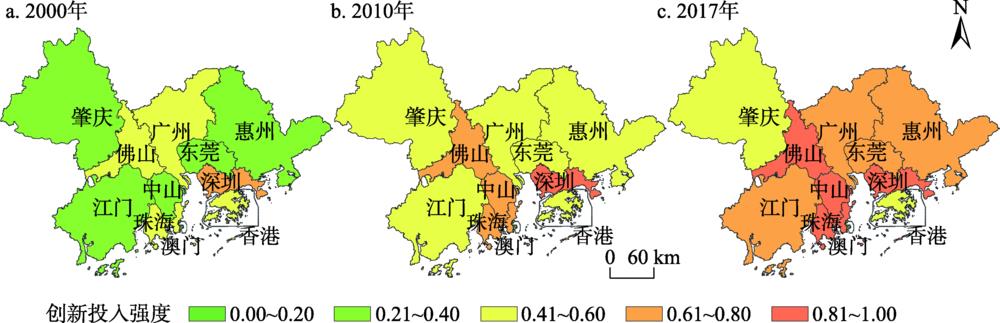
    Fig. 2. Innovation input intensity values of cities in the Guangdong-Hong Kong-Macau Greater Bay Area from 2000 to 2017
    Green economy efficiency of cities in the Guangdong-Hong Kong-Macao Greater Bay Area from 2000 to 2017
    Fig. 3. Green economy efficiency of cities in the Guangdong-Hong Kong-Macao Greater Bay Area from 2000 to 2017
    指标类型类别指标
    投入自然资源投入用水总量
    建设用地总量
    电力消耗量
    社会经济投入从业人员数量
    固定资产投资额
    产出正向产出GDP
    社会消费品零售总额
    负向产出工业固废排放量
    工业废气排放量
    工业废水排放量
    Table 1. Index system of green economy efficiency
    城市2000年2010年2017年年均上升量
    广州0.570.590.680.006
    深圳0.730.941.000.016
    珠海0.530.700.880.021
    佛山0.480.680.900.025
    江门0.300.510.700.024
    肇庆0.250.450.560.018
    惠州0.290.510.800.030
    东莞0.310.580.750.026
    中山0.380.720.890.030
    香港0.420.550.570.009
    澳门0.220.250.310.005
    Table 2. Measure values of innovation input intensity of cities in the Guangdong-Hong Hong-Macao Greater Bay Area from 2000 to 2017
    城市2000年2010年2017年
    广州1.321.541.57
    深圳1.651.622.37
    珠海1.502.513.31
    佛山1.491.210.87
    江门1.210.941.03
    肇庆1.821.491.52
    惠州4.512.540.85
    东莞1.400.791.18
    中山1.742.641.79
    香港*2.302.503.00
    澳门*3.003.504.00
    Table 3. Green economy efficiency of cities in the Guangdong-Hong Kong-Macao Greater Bay Area from 2000 to 2017
    自变量模型1模型2模型3模型4模型5
    INN0.109(0.431)0.480(0.826)1.563**(3.672)0.840(1.290)1.358**(2.971)
    SCA5.847**(4.281)-0.777(-0.885)-0.994**(-2.940)-1.230(-1.344)-0.903*(-2.338)
    ALLSEI0.334(0.838)0.053(0.030)-2.085* (-2.061)-0.350(-0.211)-1.488(-1.385)
    ALLTHI-4.725***(-6.121)0.486(0.198)0.369(0.354)0.768(0.361)0.564(0.469)
    ALLPOH-2.047(-1.860)0.587(0.783)-0.151(-0.518)0.457(0.686)-0.090(-0.267)
    ALLPOM4.117***(7.241)0.541(0.450)-0.026(-0.057)0.281(0.264)0.164(0.304)
    Table 4. The results of the model standardized coefficients estimation of the green economy efficiency in the Guangdong-Hong Kong-Macao Greater Bay Area from 2000 to 2017
    Jing CAO, Wenzhong ZHANG. The influence of urban innovation input on green economy efficiency in different periods: A case study of the Guangdong-Hong Kong-Macao Greater Bay Area[J]. Geographical Research, 2020, 39(9): 1987
    Download Citation