Author Affiliations
1School of Information Engineering, Wuhan University of Technology, Wuhan 430070, China2Hubei Key Laboratory of Broadband Wireless Communication and Sensor, Wuhan University of Technology, Wuhan 430070, Chinashow less
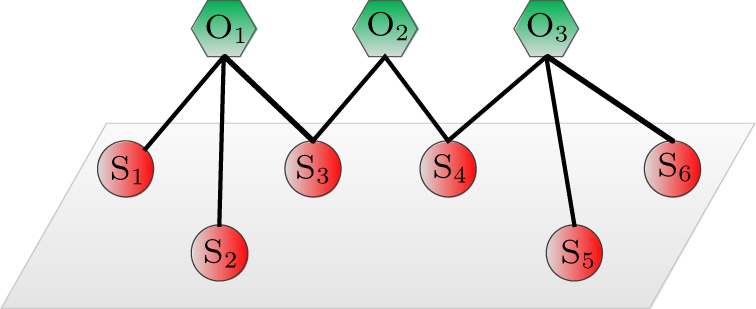
Fig. 1. Bipartite network structure.
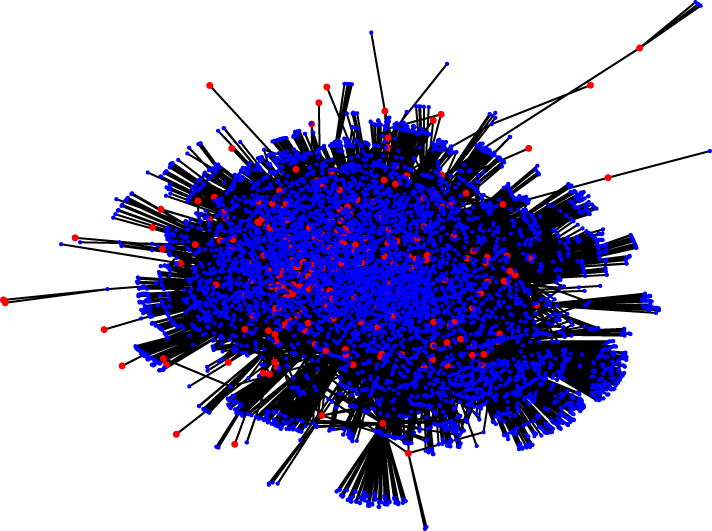
Fig. 2. MECN visualization. Red nodes are OEMs and blue nodes are part suppliers.
Fig. 3. MLE fit of degree distribution of (a) OEMs and (b) part suppliers.
Fig. 4. Degree correlation in one-mode projection network on (a) OEMs and (b) part suppliers.
Fig. 5. MECN evolutionary model construction process.
Fig. 6. MECN evolutionary model visualization. Red nodes are OEMs and blue nodes are part suppliers.
Fig. 7. Distributions of the evolutionary model (blue), compared with empirical network (red) and the degree-based model (green), showing (a) the degree distribution of OEMs, and (b) degree distribution of part suppliers.
| No | Part suppliers | Found year | Location | Registered capital | Number of intellectual properties | Number of risk warnings |
|---|
| 1 | Guangzhou Qicheng Auto Parts Co., Ltd. | 2013 | Guangdong | 2.0 × 10⁶ CNY | 1 | 6 | | 2 | Shenyang Pinghe Valeo Automotive Transmission System Co., Ltd. | 2013 | Liaoning | 3.5 × 10⁷ USD | 16 | 4 | | 3 | Shanxi Zhongjin Industrial Machinery Co., Ltd. | 1996 | Shanxi | 8.0 × 10⁶ CNY | 29 | 1 | | 4 | Conde Ryan electromagnetic technology (China) co., Ltd. | 2005 | Jiangsu | 9.8 × 10⁶ EUR | 23 | 0 | | 5 | Shanghai saks powertrain components system co., Ltd. | 2001 | Shanghai | 1.4 × 10⁷ USD | 89 | 4 |
|
Table 1. Information about part suppliers (a portion).
| Topological properties | Result |
|---|
| OEMs | 245 | | Part suppliers | 6790 | | Edges | 20938 | | Part suppliers per OEM | 85.46 | | OEMs per part suppliers | 3.08 | | Average path length L | 3.755 | | Clustering coefficient c | 0.253 | | Assortativity coefficient r | −0.480 | | (one-mode projection on OEMs) | −0.231 | | Assortativity coefficient rM | | (one-mode projection on part suppliers) | −0.021 | | Assortativity coefficient rS | | OEM degree | Max: 963 and Min: 1 | | Part supplier degree | Max: 23 and Min: 1 |
|
Table 2. Topological properties of empirical MECN.
| Distribution | p(k) | D (OEM) | D (part supplier) |
|---|
| Power law | k−α | 0.2107 | 0.1309 | | Truncated power law | k−αe−αk | 0.0545 | 0.0372 | | Exponential | e−λk | 0.3260 | 0.0301 | | Stretched exponential | (λk)β – 1e−(λk)β | 0.0649 | 0.0203 |
|
Table 3. Degree distribution fitting results of empirical MECN.
| Notation | Meaning |
|---|
| t | time step of evolution | | u0,v0,e0 | initial number of OEM nodes, part supplier nodes, and edges respectively | | e | number of edges | | nM,nS,nE | maximum number of OEM nodes, part supplier nodes, and edges respectively | | ki,kj | degree of nodes i and j respectively | | fi,fj | fitness of nodes i and j calculated by the entropy-TOPSIS method respectively | | dmax_s, dmax_m | maximum number of part supplier nodes that OEM nodes can connect with | | maximum number of OEM nodes that part supplier nodes can connect with | | Sij | probability of successful connection between nodes i and j | | q | parameter that affects where the link is deleted (from local-world or global network) | | Qi | probability of being selected as local-world network for node i |
|
Table 4. Notations used in evolutionary model.
| Topological properties | Empirical network | Evolutionary model | Degree-based model |
|---|
| OEMs | 245 | 245 | 245 | | Part suppliers | 6790 | 6790 | 6790 | | Edges | 20938 | 20938 | 20938 | | Part suppliers per OEM | 85.46 | 85.46 | 85.46 | | OEMs per part supplier | 3.08 | 3.08 | 3.08 | | Average path length L | 3.755 | 3.760 ± 0.015 | 3.854 ± 0.015 | | Clustering coefficient c | 0.253 | 0.224 ± 0.002 | 0.219 ± 0.02 | | Assortativity coefficient r | −0.480 | −0.417 ± 0.030 | −0.534 ± 0.040 | | Assortativity coefficient rM | −0.231 | −0.265 ± 0.020 | −0.203 ± 0.020 | | (one-mode projection on OEMs) | | Assortativity coefficient rS | −0.021 | −0.044 ± 0.015 | −0.034 ± 0.015 | | (one-mode projection on part suppliers) | | OEM degree | Max: 963 Min: 1 | Max: 949 ± 1 Min: 1 | Max: 600 ± 150 Min: 1 | | Part supplier degree | Max: 23 Min: 1 | Max: 22 ± 2 Min: 1 | Max: 21 ± 2 Min: 1 |
|
Table 5. Results of topological properties.
| Topological properties | Evolutionary model | Degree-based model |
|---|
| Average path length L | 0.021 | 0.099 | | Clustering coefficient c | 0.029 | 0.034 | | Average degree | 0 | 0 | | Assortativity coefficient r | 0.066 | 0.073 | | Assortativity coefficient rM | 0.036 | 0.032 | | (one-mode projection on OEMs) | | Assortativity coefficient rS | 0.036 | 0.032 | | (one-mode projection on part suppliers) |
|
Table 6. RMSD results of topological properties.