• NUCLEAR TECHNIQUES
  • Vol. 46, Issue 9, 090202 (2023)
Xian GUAN1, Xing WEI1, Zikun LI1、2, Haijun FAN1, Jipeng ZHANG1, and Tao SUN1、*
Author Affiliations
  • 1State Key Laboratory of NBC Protection for Civilian, Beijing 102205, China
  • 2Nuclear Technology Key Laboratory of Earth Science in Sichuan, Chengdu University of Technology, Chengdu 610059, China
  • show less
    DOI: 10.11889/j.0253-3219.2023.hjs.46.090202 Cite this Article
    Xian GUAN, Xing WEI, Zikun LI, Haijun FAN, Jipeng ZHANG, Tao SUN. Fast localization of radiation sources based on Support Vector Machine[J]. NUCLEAR TECHNIQUES, 2023, 46(9): 090202 Copy Citation Text show less
    Structure diagram of array NaI (Tl) detector device for radiation source location
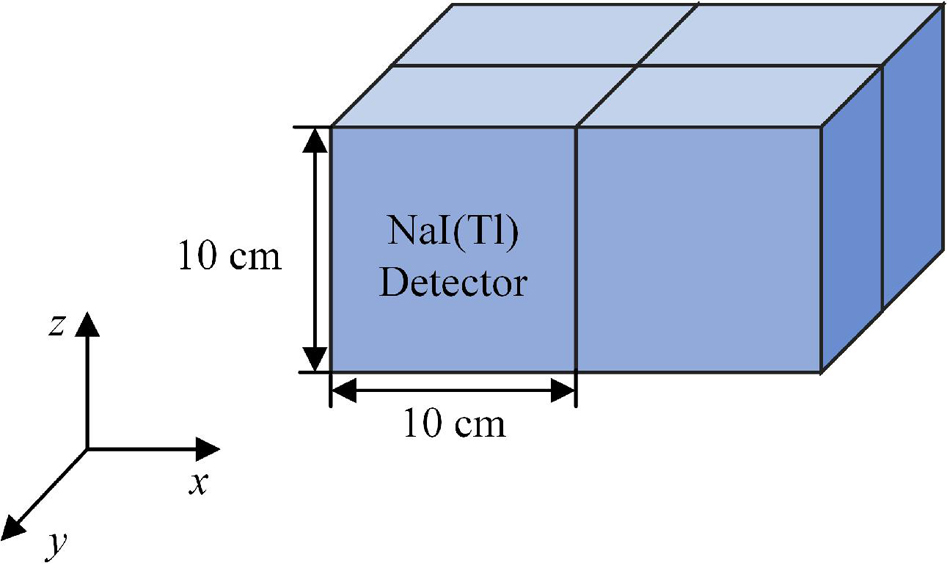
    Fig. 1. Structure diagram of array NaI (Tl) detector device for radiation source location
    Diagram of Monte Caro simulation model with parallel beam γ-ray
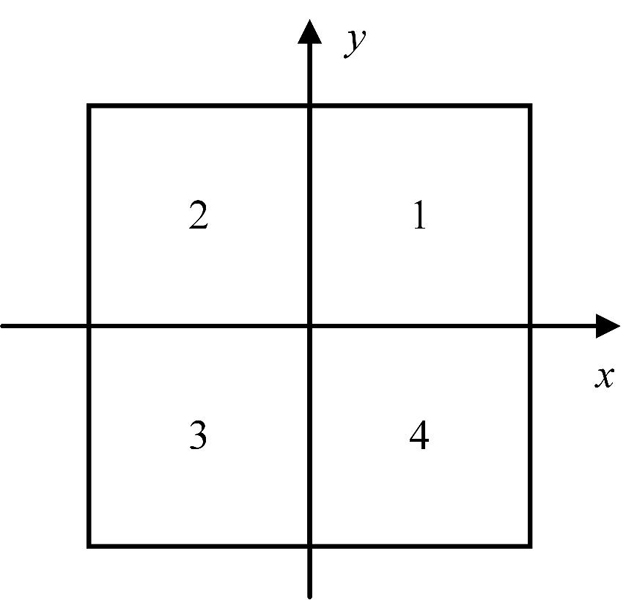
    Fig. 2. Diagram of Monte Caro simulation model with parallel beam γ-ray
    Collision distribution of particles in array detector (a) θ = 60°,(b) θ = 210°
    Fig. 3. Collision distribution of particles in array detector (a) θ = 60°,(b) θ = 210°
    Distribution curves of MC simulation gross counts with γ-ray incidence angles
    Fig. 4. Distribution curves of MC simulation gross counts with γ-ray incidence angles
    Physical photos of array NaI(Tl) detector radiation source location device (a) Array NaI(Tl) detector, (b) Array rotation platform
    Fig. 5. Physical photos of array NaI(Tl) detector radiation source location device (a) Array NaI(Tl) detector, (b) Array rotation platform
    Physical diagram of linear orbits (a) Orbits, (b) Radioactive source bracket platform
    Fig. 6. Physical diagram of linear orbits (a) Orbits, (b) Radioactive source bracket platform
    Diagram of radioactive angle response experiment
    Fig. 7. Diagram of radioactive angle response experiment
    Experiment results of radioactive angle response
    Fig. 8. Experiment results of radioactive angle response
    Proportions of gross count from energy spectra of radioactive angle response experiment
    Fig. 9. Proportions of gross count from energy spectra of radioactive angle response experiment
    Diagram of radioactive location response experiment
    Fig. 10. Diagram of radioactive location response experiment
    Results of location response experiment (a) S=1 m, (b) S=2 m, (c) S=3 m, (d) S=4 m, (e) S=5 m
    Fig. 11. Results of location response experiment (a) S=1 m, (b) S=2 m, (c) S=3 m, (d) S=4 m, (e) S=5 m
    Predicted mean angle deviation of location response experiment
    Fig. 12. Predicted mean angle deviation of location response experiment
    Results of relative height response experiment(a) Relative height 0.3 m, (b) Relative height 0.4 m, (c) Relative height 0.5 m, (d) Relative height 0.6 m
    Fig. 13. Results of relative height response experiment(a) Relative height 0.3 m, (b) Relative height 0.4 m, (c) Relative height 0.5 m, (d) Relative height 0.6 m
    Predicted mean angle deviation of relative height response experiment
    Fig. 14. Predicted mean angle deviation of relative height response experiment
    Predicted mean angle deviation with various energy γ-ray
    Fig. 15. Predicted mean angle deviation with various energy γ-ray
    Varition of mean localization deviation with the primary γ-ray intensity
    Fig. 16. Varition of mean localization deviation with the primary γ-ray intensity
    Minimum localizable intensity of radiation source
    Fig. 17. Minimum localizable intensity of radiation source
    实际角度 Actual angle / (°)预测角度Predicted angle / (°)绝对偏差Absolute deviation / (°)
    190189.410.59
    200199.110.89
    210209.540.46
    220219.910.09
    230229.630.37
    240239.730.27
    250249.830.17
    260259.630.37
    270269.990.01
    280279.730.27
    290289.740.26
    300299.720.28
    310309.780.22
    320319.730.27
    330329.540.46
    340339.250.75
    350349.480.52
    360362.532.53
    Table 1. Angle predictions of MC simulation radioactive source
    实际角度Actual angle / (°)预测角度Predicted angle / (°)绝对偏差Absolute deviation / (°)实际角度Actual angle / (°)预测角度Predicted angle / (°)绝对偏差Absolute deviation / (°)
    190185.404.60280282.502.50
    200195.324.68290291.941.94
    210205.174.83300300.180.18
    220216.043.96310310.250.25
    230225.414.59320320.460.46
    240234.055.95330329.500.50
    250246.483.52340339.060.94
    260257.522.48350345.074.93
    270265.894.11360353.506.50
    Table 2. Prediction of angle response experiment results
    相对高度Relative height / m各测量点探测器全谱计数之和 Sum of the full spectrum counts of each measurement point detector
    1号 No.12号 No.23号 No.34号 No.4总和 Total
    0.314 710 83627 439 60827 838 79513 933 09083 922 329
    0.414 710 83627 439 60827 838 79513 933 09083 922 329
    0.514 765 71727 702 87928 117 65514 117 33784 703 588
    0.614 770 56227 758 67228 226 40714 131 30484 886 945
    Table 3. Results of relative height response experiment
    Xian GUAN, Xing WEI, Zikun LI, Haijun FAN, Jipeng ZHANG, Tao SUN. Fast localization of radiation sources based on Support Vector Machine[J]. NUCLEAR TECHNIQUES, 2023, 46(9): 090202
    Download Citation