Author Affiliations
1School of Geography, Nanjing Normal University, Nanjing 210023, China2Institute of Geographic Sciences and Natural Resources Research, Chinese Academy of Sciences, Beijing 100101, China3Jiangsu Center for Collaborative Innovation in Geographical Information Resource Development and Application, Nanjing 210023, China4Key Laboratory of Virtual Geographic Environment for the Ministry of Education, Nanjing Normal University, Nanjing 210023, Chinashow less
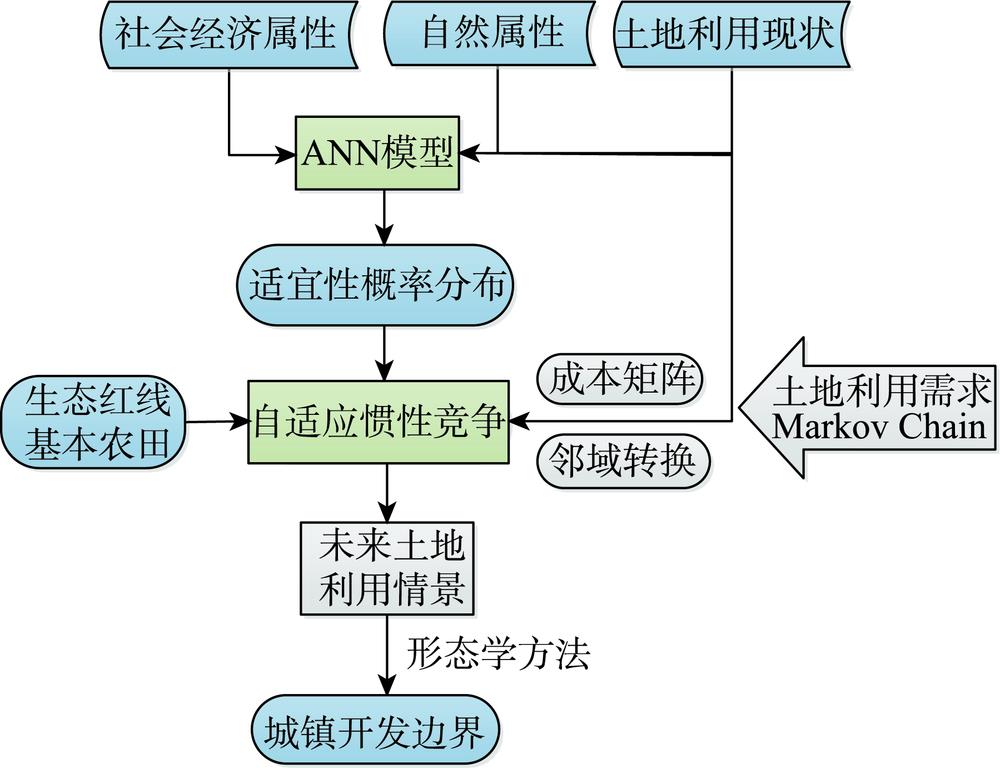
Fig. 1. Simulation flow chart of urban development boundary
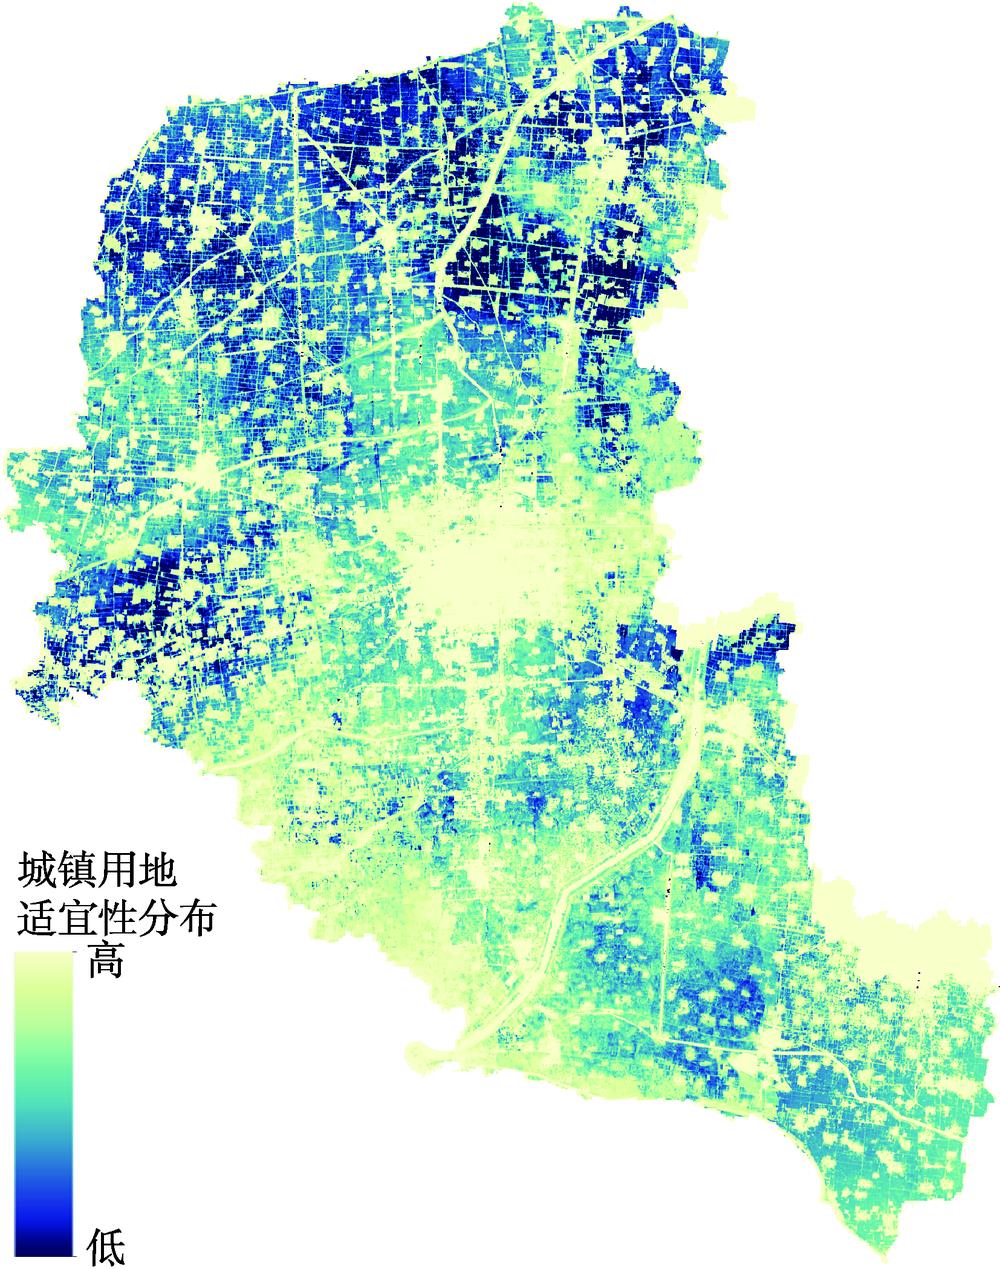
Fig. 2. Distribution of urban land suitability in Feng Country
Fig. 3. Comparison of land use simulation and status in Feng Country in 2017
Fig. 4. Simulation of land use of 2035 in baseline scenario in Feng Country
Fig. 5. Simulation of land use of 2035 under farmland protection scenario in Feng Country
Fig. 6. Simulation of land use of 2035 under farmland protection ecological control scenario in Feng Country
Fig. 7. Comparison of urban land expansions and status in Feng Country in 2017
Fig. 8. The UGBs delineation of Feng Country in 2035
Fig. 9. The area of urban land area in different areas of Feng County
类型 | 名称 | 数据描述 | 数据来源 | 年份 |
---|
驱动因子 | 自然属性 | 高程/m | GDEMDEM-30M数字高程数据 | 地理空间数据云[35] | 2009 | | | 坡度/° | 由高程数据计算得到 | | 2009 | | | 植被覆盖度 | 由Landsat 8遥感数据计算NDVI指数 | 美国地质勘探局[36] | 2017 | | | 土壤质量 | 由Landsat 8遥感数据计算MSAVI指数[34] | | 2017 | | 社会经济属性 | 生活配套设施 | 百度地图POI数据 | 百度地图开放平台[37] | 2018 | | | 到县城距离/km | 到中心城区的欧式距离 | 全国基础地理数据库[38] | 2018 | | | 到重点镇距离/km | 到重点镇的欧式距离 | | 2018 | | | 火车站可达性/min | 到火车站的时间距离 | | 2016 | | | 主干道可达性/min | 到城市主干道和一级公路的时间距离 | | 2016 | | | 高速互通可达性/min | 到高速公路出入口的时间距离 | | 2016 | | | 港口可达性/min | 到港口的时间距离 | | 2016 | | | 人口分布 | 丰县人口分布数据 | 丰县规划局 | 2018 | | | 经济分布 | “珞珈一号”夜光数据 | 高分湖北中心[39] | 2018 | 限制因子 | 限制区 | 基本农田分布 | 丰县永久基本农田分布 | 丰县土地利用总体规划(2016—2020) | 2020 | | | 生态红线区分布 | 丰县生态红线区域分布 | 丰县生态红线区域保护规划(2015) | 2015 |
|
Table 1. The explanation of land use change driving factors in Feng Country
年份 | 耕地 | 林地 | 道路 | 交通用地 | 水域 | 城镇用地 | 农村居民点 |
---|
2011 | 1 088 520 | 38 211 | 32 126 | 147 986 | 39 504 | 43 968 | 218 164 | 2017 | 1 091 236 | 37 334 | 34 070 | 141 929 | 32 429 | 58 723 | 206 738 | 2035 | 1 092 400 | 35 761 | 36 977 | 135 502 | 26 452 | 91 553 | 186 843 |
|
Table 2. [in Chinese]
土地利用类型 | 2011年 |
---|
耕地 | 林地 | 交通用地 | 水域 | 未利用地 | 城镇用地 | 农村居民点 |
---|
2017年 | 耕地 | 98.24 | 0.00 | 0.15 | 0.03 | 0.35 | 1.13 | 0.09 | | 林地 | 0.19 | 97.94 | 0.16 | 0.00 | 0.47 | 0.71 | 0.53 | | 交通用地 | 0.25 | 0.00 | 99.12 | 0.00 | 0.05 | 0.52 | 0.06 | | 水域 | 3.20 | 0.00 | 0.31 | 95.99 | 0.06 | 0.35 | 0.09 | | 未利用地 | 25.21 | 0.00 | 0.30 | 0.08 | 72.03 | 2.04 | 0.35 | | 城镇用地 | 1.64 | 0.00 | 0.00 | 0.08 | 0.00 | 97.41 | 0.87 | | 农村居民点 | 4.69 | 0.01 | 0.08 | 0.00 | 0.02 | 0.91 | 94.29 |
|
Table 3. Land Use Transfer Matrix of Feng County from 2011 to 2017 (%)
转换成本 | 耕地 | 林地 | 交通用地 | 水域 | 未利用地 | 城镇用地 | 农村居民点 |
---|
耕地 | 1 | 0 | 0.2 | 0.1 | 0.1 | 0.1 | 0.1 | 林地 | 0.2 | 1 | 0.2 | 0 | 0.1 | 0.1 | 0.1 | 交通用地 | 1 | 1 | 1 | 1 | 0.1 | 0.2 | 0.1 | 水域 | 0.1 | 0.2 | 0 | 1 | 0 | 0 | 0 | 未利用地 | 1 | 1 | 0.2 | 1 | 1 | 0.3 | 0.2 | 城镇用地 | 1 | 1 | 0 | 1 | 0 | 1 | 0.2 | 农村居民点 | 1 | 1 | 0.1 | 1 | 1 | 0.2 | 1 |
|
Table 4. Land use type conversion cost matrix in Feng Country
| 耕地 | 林地 | 交通用地 | 水域 | 未利用地 | 城镇用地 | 农村居民点 |
---|
面积变化量 | 0.43 | -2.11 | 6.29 | -3.91 | -17.72 | 33.74 | -5.04 |
|
Table 5. Land use area change in Feng Country from 2011 to 2017 (%)
| 耕地 | 林地 | 交通用地 | 水域 | 未利用地 | 城镇用地 | 农村居民点 |
---|
领域权重 | 1 | 1 | 0.2 | 1 | 0.3 | 1 | 0.2 |
|
Table 6. The Weight of Neighborhood of FLUS model in Feng Country
行政区 | 2035年新增面积/km2 | 2035年城镇开发范围/km2 | 增长面积/km2 | 增长幅度/% |
---|
孙楼街道 | 2.52 | 7.31 | 4.79 | 190.16 | 欢口镇 | 1.94 | 5.32 | 3.38 | 174.08 | 师寨镇 | 0.68 | 1.65 | 0.97 | 142.36 | 常店镇 | 3.86 | 7.99 | 4.13 | 106.89 | 首羡镇 | 1.53 | 3.04 | 1.51 | 98.88 | 顺河镇 | 0.79 | 1.44 | 0.65 | 82.62 | 凤城街道 | 15.47 | 26.85 | 11.38 | 73.54 | 范楼镇 | 0.97 | 1.58 | 0.61 | 62.65 | 赵庄镇 | 2.32 | 3.12 | 0.80 | 34.40 | 华山镇 | 2.96 | 3.82 | 0.86 | 29.02 | 宋楼镇 | 2.37 | 2.99 | 0.62 | 26.11 | 王沟镇 | 2.16 | 2.43 | 0.27 | 12.42 | 中阳里街道 | 15.86 | 17.62 | 1.76 | 11.10 | 大沙河镇 | 2.61 | 2.52 | -0.09 | -3.28 | 梁寨镇 | 1.58 | 1.52 | -0.06 | -3.68 | 总计 | 57.62 | 89.19 | 31.57 | 54.80 |
|
Table 7. The UGBs area of each administrative region in 2035 in Feng Country