• Photonics Research
  • Vol. 8, Issue 6, 884 (2020)
Yiyang Luo1、2、†,*, Ran Xia1、2、3、†, Perry Ping Shum1、2, Wenjun Ni1、2, Yusong Liu1、2、3, Huy Quoc Lam4, Qizhen Sun3, Xiahui Tang3, and Luming Zhao3
Author Affiliations
  • 1CINTRA CNRS/NTU/THALES, UMI 3288, Research Techno Plaza, 50 Nanyang Drive, Singapore 637553, Singapore
  • 2School of Electrical and Electronic Engineering, Nanyang Technological University, Singapore 639798, Singapore
  • 3School of Optical and Electronic Information & Wuhan National Laboratory for Optoelectronics, Huazhong University of Science and Technology, Wuhan 430074, China
  • 4Temasek Laboratories @ NTU, Research Techno Plaza, 50 Nanyang Drive, Singapore 637553, Singapore
  • show less
    DOI: 10.1364/PRJ.387438 Cite this Article Set citation alerts
    Yiyang Luo, Ran Xia, Perry Ping Shum, Wenjun Ni, Yusong Liu, Huy Quoc Lam, Qizhen Sun, Xiahui Tang, Luming Zhao. Real-time dynamics of soliton triplets in fiber lasers[J]. Photonics Research, 2020, 8(6): 884 Copy Citation Text show less
    (a) Schematic diagram of the NPR-based mode-locked fiber laser and the real-time characterization setup; (b) graphical representation of leading, central, and tailing pulses; (c) sketch of the temporal distribution, spectral interferograms, and first-order autocorrelation traces for the equally spaced soliton triplet, vibrating soliton triplet, and unequally spaced soliton triplet. DFT, dispersive Fourier transform; FFT, fast Fourier transform.
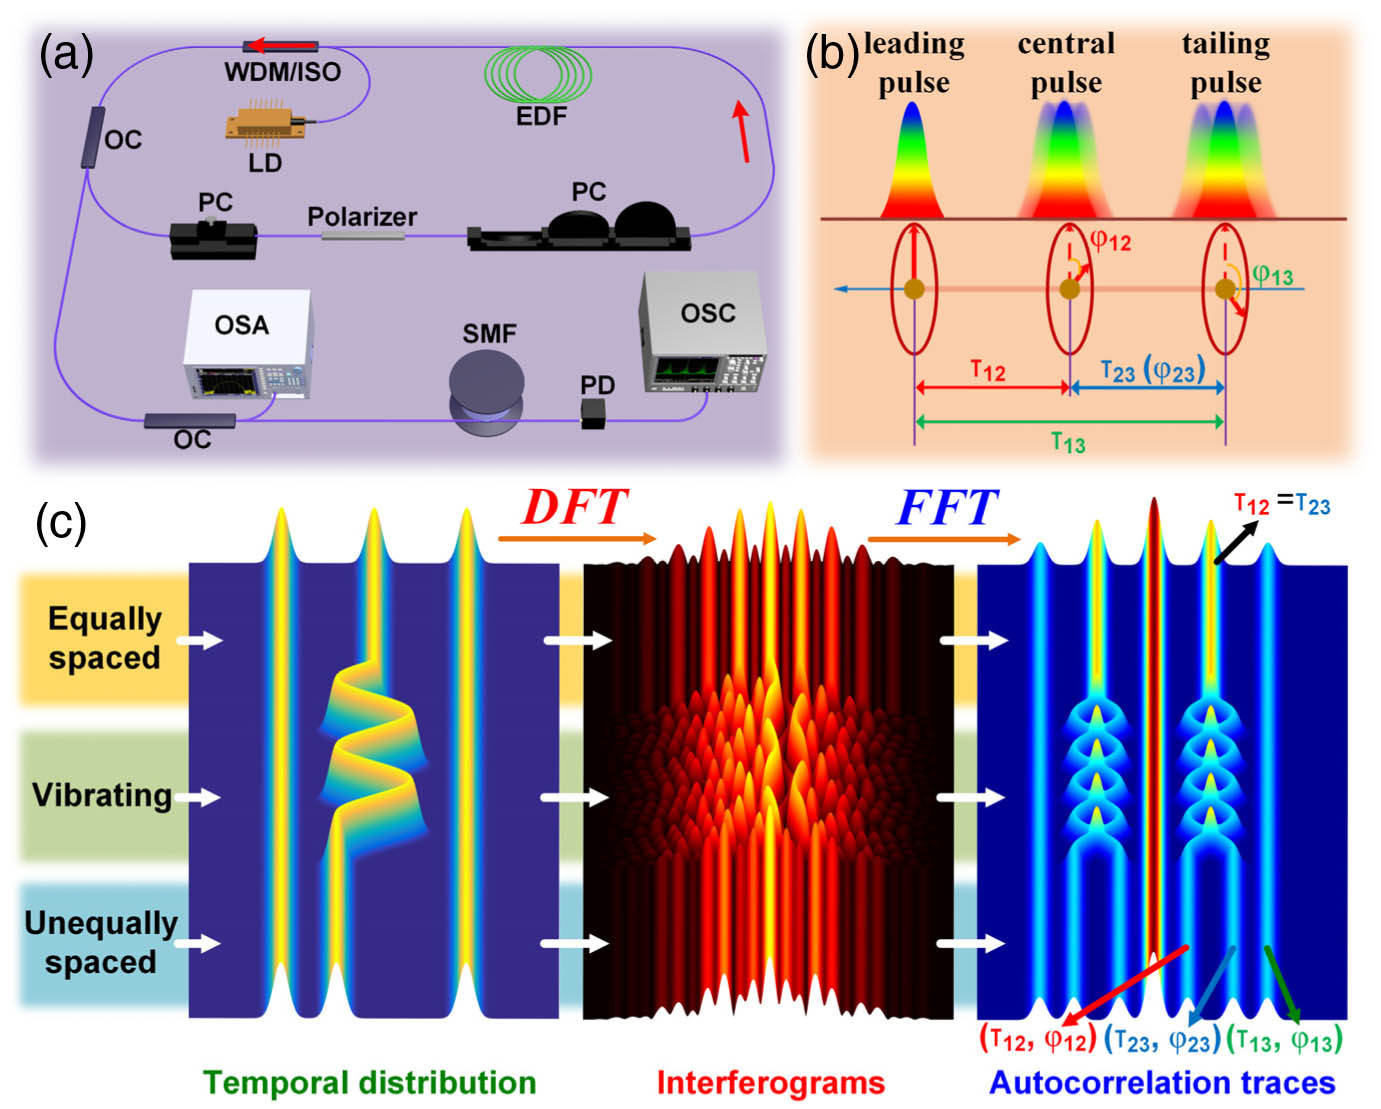
    Fig. 1. (a) Schematic diagram of the NPR-based mode-locked fiber laser and the real-time characterization setup; (b) graphical representation of leading, central, and tailing pulses; (c) sketch of the temporal distribution, spectral interferograms, and first-order autocorrelation traces for the equally spaced soliton triplet, vibrating soliton triplet, and unequally spaced soliton triplet. DFT, dispersive Fourier transform; FFT, fast Fourier transform.
    Stationary equally spaced soliton triplet. (a) Averaged DFT spectrum (black line) and OSA-measured spectrum (red line); (b), (c) pulse trains before and after DFT; (d) 2D contour plot of the shot-to-shot spectra, and the inset shows the close-up; (e) 2D contour plot of the shot-to-shot first-order autocorrelation traces; (f), (g) retrieved temporal separations and relative phases of the central pulse and tailing pulse.
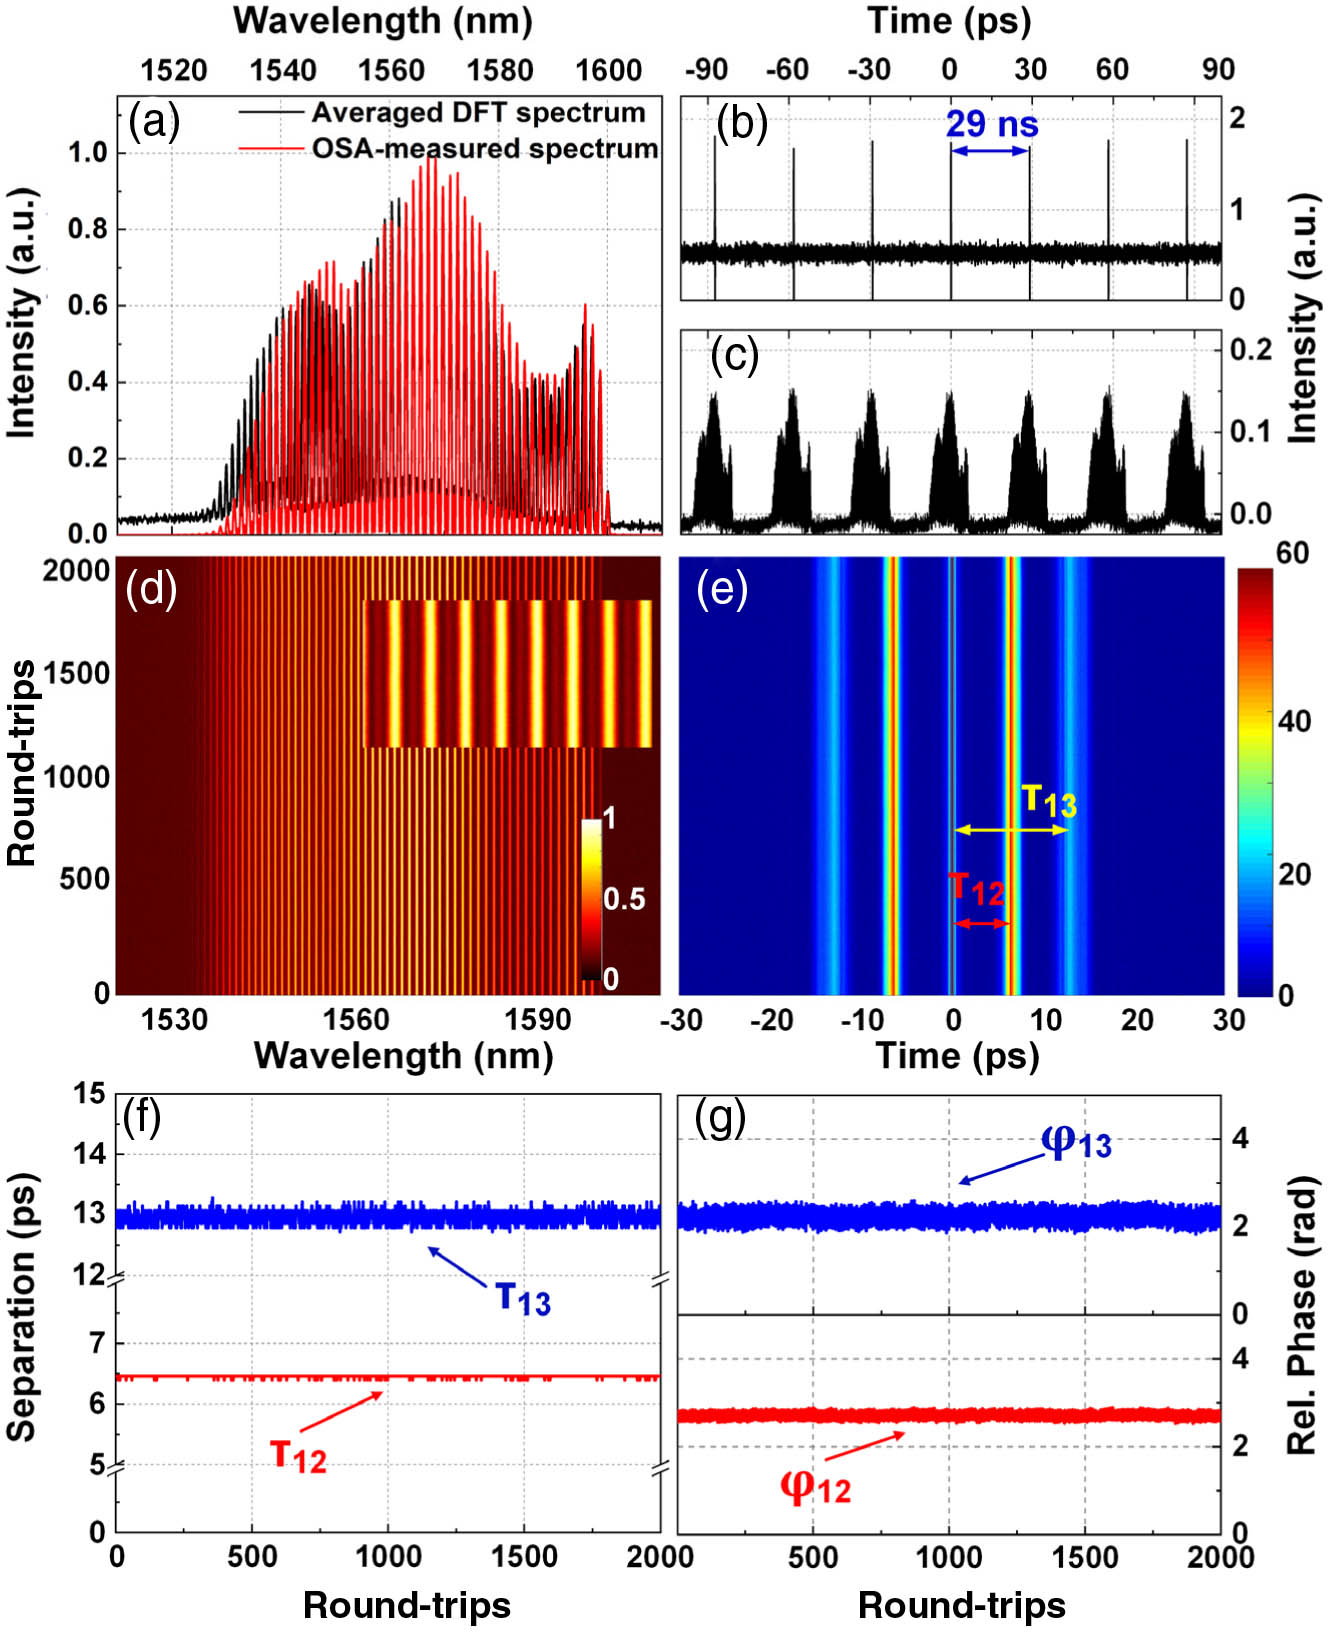
    Fig. 2. Stationary equally spaced soliton triplet. (a) Averaged DFT spectrum (black line) and OSA-measured spectrum (red line); (b), (c) pulse trains before and after DFT; (d) 2D contour plot of the shot-to-shot spectra, and the inset shows the close-up; (e) 2D contour plot of the shot-to-shot first-order autocorrelation traces; (f), (g) retrieved temporal separations and relative phases of the central pulse and tailing pulse.
    Vibrating equally spaced soliton triplet. (a) 2D contour plot of the shot-to-shot spectra; (b) 2D contour plot of the shot-to-shot first-order autocorrelation traces; (c), (d) close-ups of the spectra and autocorrelation traces; (e) retrieved temporal separations of the central pulse and tailing pulse; (f), (g) trajectories of (τ12, φ12) and (τ13, φ13) in the interaction spaces.
    Fig. 3. Vibrating equally spaced soliton triplet. (a) 2D contour plot of the shot-to-shot spectra; (b) 2D contour plot of the shot-to-shot first-order autocorrelation traces; (c), (d) close-ups of the spectra and autocorrelation traces; (e) retrieved temporal separations of the central pulse and tailing pulse; (f), (g) trajectories of (τ12, φ12) and (τ13, φ13) in the interaction spaces.
    Vibrating equally spaced soliton triplet. (a) 2D contour plot of the shot-to-shot spectra; (b) 2D contour plot of the shot-to-shot first-order autocorrelation traces; (c), (d) close-ups of the spectra and autocorrelation traces; (e) retrieved relative phases of the central pulse (top panel) and tailing pulse (bottom panel); (f) retrieved temporal separation of the central pulse.
    Fig. 4. Vibrating equally spaced soliton triplet. (a) 2D contour plot of the shot-to-shot spectra; (b) 2D contour plot of the shot-to-shot first-order autocorrelation traces; (c), (d) close-ups of the spectra and autocorrelation traces; (e) retrieved relative phases of the central pulse (top panel) and tailing pulse (bottom panel); (f) retrieved temporal separation of the central pulse.
    Unequally spaced soliton triplet with oscillating phase. (a) 2D contour plot of the shot-to-shot spectra; (b), (c) close-ups of the spectra with different magnifications; (d) 2D contour plot of the shot-to-shot first-order autocorrelation traces; (e) retrieved relative phases of φ12, φ23, and φ13, and the insets show the close-ups; (f) trajectories in the interaction plane; (g) trajectories of (τ12, φ12) and (τ13, φ13) in the interaction space; (h) oscillatory frequency of the phase evolution for the shaking soliton molecule.
    Fig. 5. Unequally spaced soliton triplet with oscillating phase. (a) 2D contour plot of the shot-to-shot spectra; (b), (c) close-ups of the spectra with different magnifications; (d) 2D contour plot of the shot-to-shot first-order autocorrelation traces; (e) retrieved relative phases of φ12, φ23, and φ13, and the insets show the close-ups; (f) trajectories in the interaction plane; (g) trajectories of (τ12, φ12) and (τ13, φ13) in the interaction space; (h) oscillatory frequency of the phase evolution for the shaking soliton molecule.
    Unequally spaced soliton triplet with stepping phase evolution. (a) 2D contour plot of the shot-to-shot spectra; (b) 2D contour plot of the shot-to-shot first-order autocorrelation traces; (c) retrieved temporal separations of τ12, τ23, and τ13; (d) retrieved relative phases of φ12, φ23, and φ13; (e) trajectories of (τ12, φ12) and (τ13, φ13) in the interaction space.
    Fig. 6. Unequally spaced soliton triplet with stepping phase evolution. (a) 2D contour plot of the shot-to-shot spectra; (b) 2D contour plot of the shot-to-shot first-order autocorrelation traces; (c) retrieved temporal separations of τ12, τ23, and τ13; (d) retrieved relative phases of φ12, φ23, and φ13; (e) trajectories of (τ12, φ12) and (τ13, φ13) in the interaction space.
    Analytical fit for the soliton triplet with stepping phase evolution. (a) Evolution of the temporal separations and (b) the relative phases between constituents of the triplet; (c) temporal distribution; (d) corresponding evolution of the spectral intensity profile; (e) corresponding first-order autocorrelation trace.
    Fig. 7. Analytical fit for the soliton triplet with stepping phase evolution. (a) Evolution of the temporal separations and (b) the relative phases between constituents of the triplet; (c) temporal distribution; (d) corresponding evolution of the spectral intensity profile; (e) corresponding first-order autocorrelation trace.
    Yiyang Luo, Ran Xia, Perry Ping Shum, Wenjun Ni, Yusong Liu, Huy Quoc Lam, Qizhen Sun, Xiahui Tang, Luming Zhao. Real-time dynamics of soliton triplets in fiber lasers[J]. Photonics Research, 2020, 8(6): 884
    Download Citation