• Chinese Journal of Lasers
  • Vol. 47, Issue 10, 1007001 (2020)
Ma Yiming1, Ma Liyong1、2, Qin Zezheng1, and Sun Mingjian1、2、*
Author Affiliations
  • 1School of Information Science and Engineering, Harbin Institute of Technology, Weihai, Shandong 264209, China
  • 2School of Astronautics, Harbin Institute of Technology, Harbin, Heilongjiang 150000, China
  • show less
    DOI: 10.3788/CJL202047.1007001 Cite this Article Set citation alerts
    Ma Yiming, Ma Liyong, Qin Zezheng, Sun Mingjian. Photothermal Therapy Method Based on Precise Regulation of Photoacoustic Temperature[J]. Chinese Journal of Lasers, 2020, 47(10): 1007001 Copy Citation Text show less
    Control block diagram
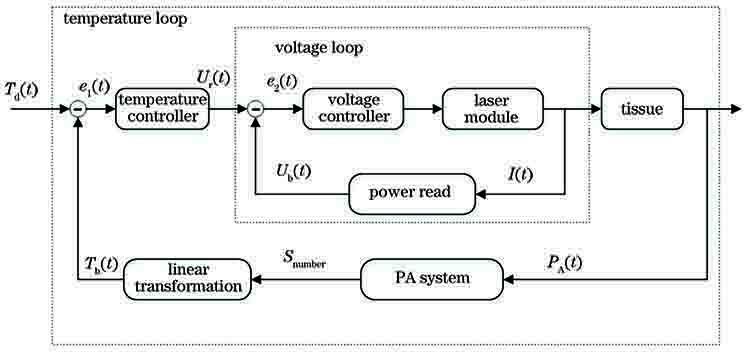
    Fig. 1. Control block diagram
    Schematic of experimental setup
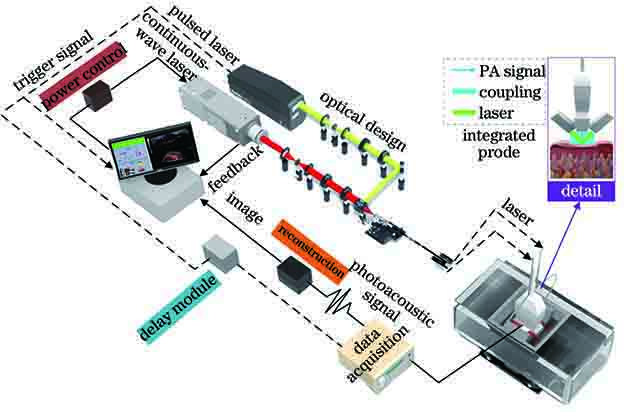
    Fig. 2. Schematic of experimental setup
    Light source of PTT system. (a) Overall optical path; (b) pulse laser; (c) continuous laser
    Fig. 3. Light source of PTT system. (a) Overall optical path; (b) pulse laser; (c) continuous laser
    Integrated probe. (a) Lateral view of the probe; (b) light exit of the probe; (c) 3D model of the integrated probe
    Fig. 4. Integrated probe. (a) Lateral view of the probe; (b) light exit of the probe; (c) 3D model of the integrated probe
    Power control module of the PTT system
    Fig. 5. Power control module of the PTT system
    Physical map of experimental phantom. (a) Side view of the phantom; (b) top view of the phantom; (c) the control variable
    Fig. 6. Physical map of experimental phantom. (a) Side view of the phantom; (b) top view of the phantom; (c) the control variable
    Peak-to-peak value of photoacoustic signal of phantoms
    Fig. 7. Peak-to-peak value of photoacoustic signal of phantoms
    Linear relationship between temperature and photoacoustic signal of each phantom. (a) Control group 1; (b) control group 2; (c) control group 3; (d) control group 4; (e) control group 5; (f) control group 6
    Fig. 8. Linear relationship between temperature and photoacoustic signal of each phantom. (a) Control group 1; (b) control group 2; (c) control group 3; (d) control group 4; (e) control group 5; (f) control group 6
    Variation of photoacoustic signal with temperature
    Fig. 9. Variation of photoacoustic signal with temperature
    Photoacoustic image of vascular phantom
    Fig. 10. Photoacoustic image of vascular phantom
    Photoacoustic images and sampling signals at different temperatures. (a) Photoacoustic image at 31 ℃; (b) photoacoustic image at 36 ℃; (c) photoacoustic image at 41 ℃; (d) photoacoustic signal at 41 ℃; (e) photoacoustic signal at 36 ℃; (f) photoacoustic signal at 31 ℃
    Fig. 11. Photoacoustic images and sampling signals at different temperatures. (a) Photoacoustic image at 31 ℃; (b) photoacoustic image at 36 ℃; (c) photoacoustic image at 41 ℃; (d) photoacoustic signal at 41 ℃; (e) photoacoustic signal at 36 ℃; (f) photoacoustic signal at 31 ℃
    Distribution curve of intensity values in photoacoustic image matrix
    Fig. 12. Distribution curve of intensity values in photoacoustic image matrix
    Linear fitting result between photoacoustic data and actual temperature of phantom. (a) Sensitive point of photoacoustic temperature; (b) average pixel value
    Fig. 13. Linear fitting result between photoacoustic data and actual temperature of phantom. (a) Sensitive point of photoacoustic temperature; (b) average pixel value
    Multimodal reconstruction. (a) Photoacoustic image; (b) ultrasound image; (c) temperature distribution image
    Fig. 14. Multimodal reconstruction. (a) Photoacoustic image; (b) ultrasound image; (c) temperature distribution image
    Temperature of human tissue phantom
    Fig. 15. Temperature of human tissue phantom
    Deviation of measured temperature for human tissue phantom
    Fig. 16. Deviation of measured temperature for human tissue phantom
    Temperature measured by thermocouple and photoacoustic method
    Fig. 17. Temperature measured by thermocouple and photoacoustic method
    GroupnumberDeionized waterquality md /gAgar qualityma /gInk qualitymi /g
    010.0350.4030
    110.0150.4020.009
    210.0280.4010.020
    310.0050.4010.040
    410.0110.3990.069
    510.0260.4020.092
    610.0160.4010.126
    Table 1. Parameters of phantom
    MethodMaximumfollowingerror Em /℃Root meansquareerror /℃Adjustmenttime ts /s
    Thermocouple±1.20.946.8
    Photoacoustics±1.10.637.3
    Table 2. Temperature control accuracy of two temperature measurement methods
    Ma Yiming, Ma Liyong, Qin Zezheng, Sun Mingjian. Photothermal Therapy Method Based on Precise Regulation of Photoacoustic Temperature[J]. Chinese Journal of Lasers, 2020, 47(10): 1007001
    Download Citation