• Opto-Electronic Science
  • Vol. 2, Issue 1, 220019 (2023)
Yuxiang Chen1、†, Fengyu Zhang2、4、†, Zhibo Dang1, Xiao He1, Chunxiong Luo2、4, Zhengchang Liu3, Pu Peng1, Yuchen Dai3, Yijing Huang1, Yu Li3, and Zheyu Fang1、3、*
Author Affiliations
  • 1School of Physics, Peking University, Beijing 100871, China
  • 2The State Key Laboratory for Artificial Microstructures and Mesoscopic Physics, School of Physics & Center for Quantitative Biology, Academy for Advanced Interdisciplinary Studies, Peking University, Beijing 100871, China
  • 3Academy for Advanced Interdisciplinary Studies, Peking University, Beijing 100871, China
  • 4Wenzhou Institute, University of Chinese Academy of Sciences, Wenzhou 325001, China
  • show less
    DOI: 10.29026/oes.2023.220019 Cite this Article
    Yuxiang Chen, Fengyu Zhang, Zhibo Dang, Xiao He, Chunxiong Luo, Zhengchang Liu, Pu Peng, Yuchen Dai, Yijing Huang, Yu Li, Zheyu Fang. Chiral detection of biomolecules based on reinforcement learning[J]. Opto-Electronic Science, 2023, 2(1): 220019 Copy Citation Text show less
    A design algorithm based on reinforcement learning. The entire workflow is a circle of four steps (a-d). (a) Dataset composed of nanostructures and corresponding spectra. The spectra are calculated with electromagnetic simulations. (b) Train different ANNs. (c) Possible optimized structures proposed by ANNs. (d) Classifications for possible optimized structures. Compare the results from different ANNs. The spectra are accurate and the structures are optimized when the ANNs give the same predictions. Other structures are totally new for the existed data and added to dataset.
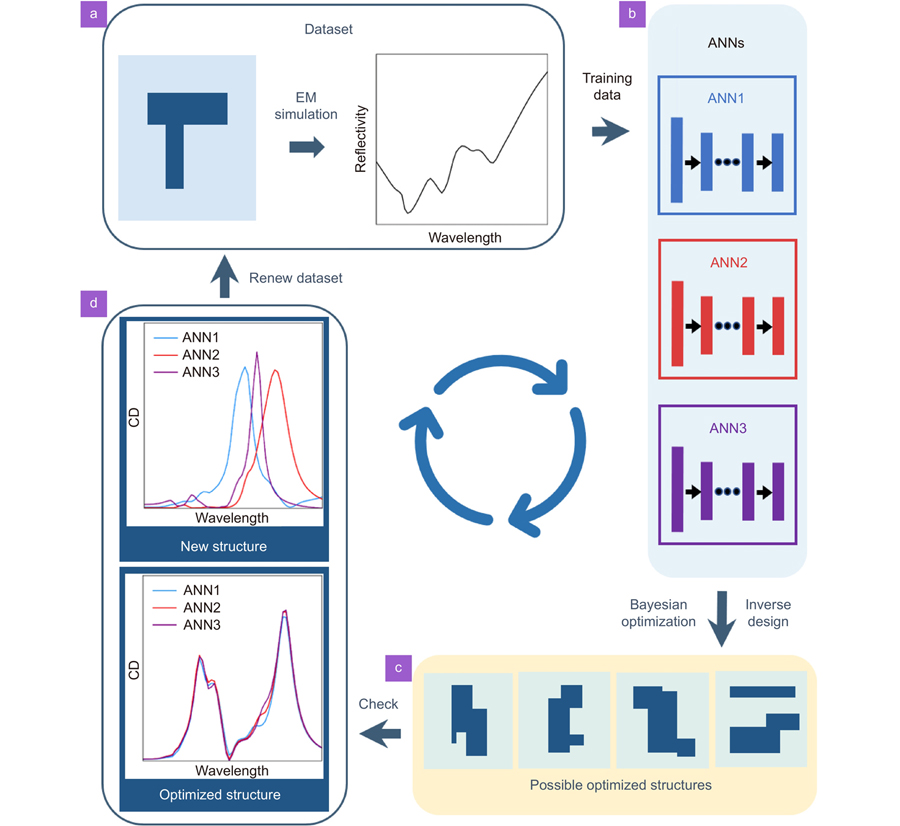
    Fig. 1. A design algorithm based on reinforcement learning. The entire workflow is a circle of four steps (a-d). (a) Dataset composed of nanostructures and corresponding spectra. The spectra are calculated with electromagnetic simulations. (b) Train different ANNs. (c) Possible optimized structures proposed by ANNs. (d) Classifications for possible optimized structures. Compare the results from different ANNs. The spectra are accurate and the structures are optimized when the ANNs give the same predictions. Other structures are totally new for the existed data and added to dataset.
    Details of the deep learning algorithm involved. We show the geometry of nanostructures (a–c), parameterization (c), the structure of ANNs (d) and performances of the ANNs (e–f). (a) Periodic arrays of chiral nanostructures. (b) The side view of a structure. (c) The top view of a structure and parameterization. The geometry is encoded to 0 and 1. (d) ANN structure. ANNs analyze parameterized geometry and predict reflective spectra with a right-circularly polarized incidence. ANNs mainly consist of multiple convolutional (Conv) layers and fully connection (FC) layers. (e) ANNs’ performance in prediction of reflective spectra with a right-circularly polarized incidence. (f) ANNs’ performance in prediction of CD spectra.
    Fig. 2. Details of the deep learning algorithm involved. We show the geometry of nanostructures (ac), parameterization (c), the structure of ANNs (d) and performances of the ANNs (ef). (a) Periodic arrays of chiral nanostructures. (b) The side view of a structure. (c) The top view of a structure and parameterization. The geometry is encoded to 0 and 1. (d) ANN structure. ANNs analyze parameterized geometry and predict reflective spectra with a right-circularly polarized incidence. ANNs mainly consist of multiple convolutional (Conv) layers and fully connection (FC) layers. (e) ANNs’ performance in prediction of reflective spectra with a right-circularly polarized incidence. (f) ANNs’ performance in prediction of CD spectra.
    Experiment results for optimized structures at the target wavelength of 850 nm (a–d), 750 nm (e–h) and 925 nm (i–l). (a, e, i) SEM images. (b, f, j) CD spectra of experiments and simulations. (c, g, k) The LCP component of CL mapping. (d, h, l) The RCP component of CL mapping.
    Fig. 3. Experiment results for optimized structures at the target wavelength of 850 nm (ad), 750 nm (eh) and 925 nm (il). (a, e, i) SEM images. (b, f, j) CD spectra of experiments and simulations. (c, g, k) The LCP component of CL mapping. (d, h, l) The RCP component of CL mapping.
    Differentiation of enantiomers. (a) Structures of microfluidic chips. (b–d) CD spectra of different solutions on metasurfaces with a CD peak at the wavelength of 750 nm, 850 nm and 925 nm. The contrast of solutions of L-glucose, NaCl and D-glucose present an obvious frequency shift
    Fig. 4. Differentiation of enantiomers. (a) Structures of microfluidic chips. (bd) CD spectra of different solutions on metasurfaces with a CD peak at the wavelength of 750 nm, 850 nm and 925 nm. The contrast of solutions of L-glucose, NaCl and D-glucose present an obvious frequency shift
    Yuxiang Chen, Fengyu Zhang, Zhibo Dang, Xiao He, Chunxiong Luo, Zhengchang Liu, Pu Peng, Yuchen Dai, Yijing Huang, Yu Li, Zheyu Fang. Chiral detection of biomolecules based on reinforcement learning[J]. Opto-Electronic Science, 2023, 2(1): 220019
    Download Citation