
Teng-Yu Ma, Wan-Jun Li, Xian-Wang He, Hui Hu, Li-Juan Huang, Hong Zhang, Yuan-Qiang Xiong, Hong-Lin Li, Li-Juan Ye, Chun-Yang Kong. Size Regulation and Photoluminescence Properties of β-Ga2O3 Nanomaterials [J]. Acta Physica Sinica, 2020, 69(10): 108102-1
- Acta Physica Sinica
- Vol. 69, Issue 10, 108102-1 (2020)
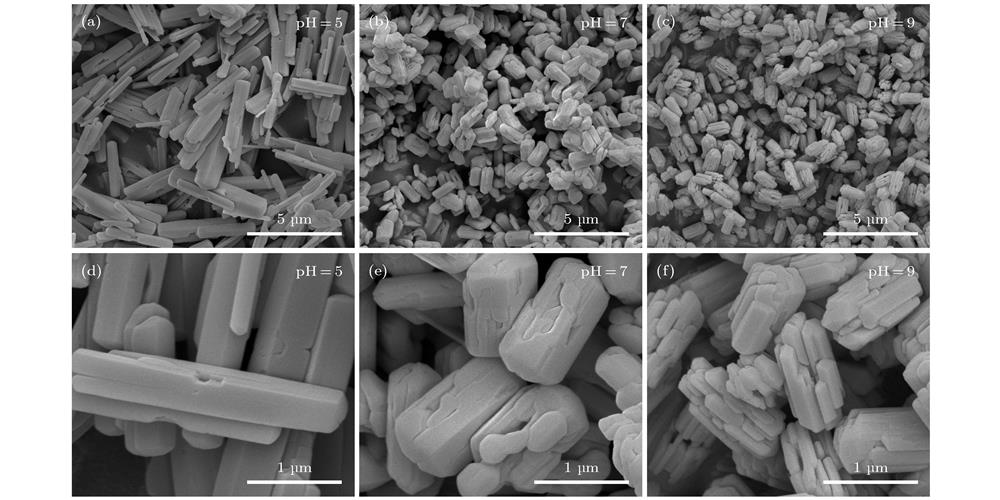
Fig. 1. Typical SEM images of GaOOH at different pH values: (a), (d) pH = 5; (b), (e) pH = 7; (c), (f) pH = 9.
Fig. 1. XRD patterns of samples under different pH values and SDBS concentrations: (a) GaOOH; (b) β-Ga2O3.
Fig. 2. Raman spectra of β-Ga2O3samples at different pH values and SDBS concentrations.
Fig. 2. Typical SEM images of GaOOH added with SDBS at pH = 5: (a), (d) 0 mmol/L; (b), (e) 0.4 mmol/L; (c), (f) 0.8 mmol/L.
Fig. 3. Typical SEM images of β -Ga2O3 at different pH values of (a), (d) pH = 5, (b), (e) pH = 7 and (c), (f) pH = 9; (g)—(i) length distribution.
Fig. 3. Typical SEM images of GaOOH added with SDBS at pH = 9: (a), (d) 0 mmol/L; (b), (e) 0.4 mmol/L; (c), (f) 0.8 mmol/L.
Fig. 4. Typical SEM images of β -Ga2O3 added with SDBS at pH = 5: (a), (d) 0 mmol/L; (b), (e) 0.4 mmol/L; (c), (f) 0.8 mmol/L; (g)−(i) length distribution.
Fig. 5. Typical SEM images of β-Ga2O3 added with SDBS at pH = 9: (a), (d) 0 mmol/L; (b), (e) 0.4 mmol/L; (c), (f) 0.8 mmol/L; (g)−(i) length distribution.
Fig. 6. Growth mechanism of GaOOH at different pH and SDBS concentrations.
Fig. 7. Room temperature PL of β-Ga2O3: (a) Different pH values without SDBS; (b) with different concentrations of SDBS at pH = 5; (c) with different concentrations of SDBS at pH = 9.

Set citation alerts for the article
Please enter your email address
© Copyright 2018-2021 | Chinese Laser Press. All Rights Reserved 沪ICP备15018463号-20