• Chinese Journal of Lasers
  • Vol. 45, Issue 9, 911015 (2018)
Liu Yang1、2, Zhang Tianshu1, Zhao Xuesong1, Zhong Liujun1, Fu Yibin1, Chen Zhenyi1, Dong Yunsheng1, and Fan Guangqiang1
Author Affiliations
  • 1[in Chinese]
  • 2[in Chinese]
  • show less
    DOI: 10.3788/CJL201845.0911015 Cite this Article Set citation alerts
    Liu Yang, Zhang Tianshu, Zhao Xuesong, Zhong Liujun, Fu Yibin, Chen Zhenyi, Dong Yunsheng, Fan Guangqiang. A Temperature Measuring Lidar Double Gratings Spectrometer with High Linear Dispersion[J]. Chinese Journal of Lasers, 2018, 45(9): 911015 Copy Citation Text show less
    Pure rotational Raman backscattering lines of N2 at 355 nm when excitation temperature is 200 K or 300 K
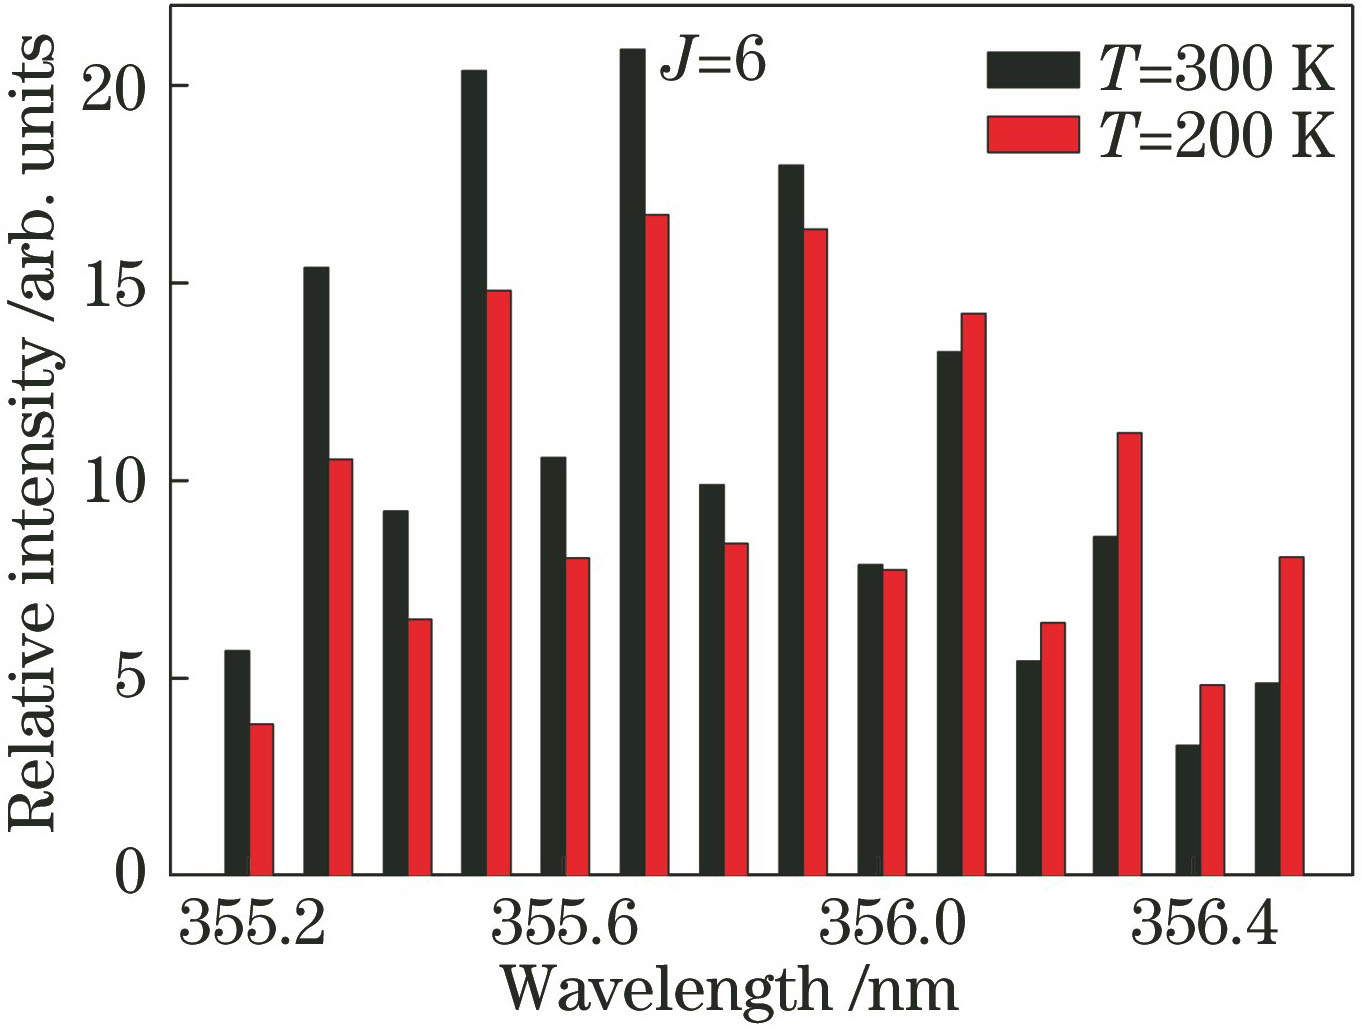
    Fig. 1. Pure rotational Raman backscattering lines of N2 at 355 nm when excitation temperature is 200 K or 300 K
    Structure diagram of temperature measuring pure rotational Raman laser lidar double gratings spectrophotometer
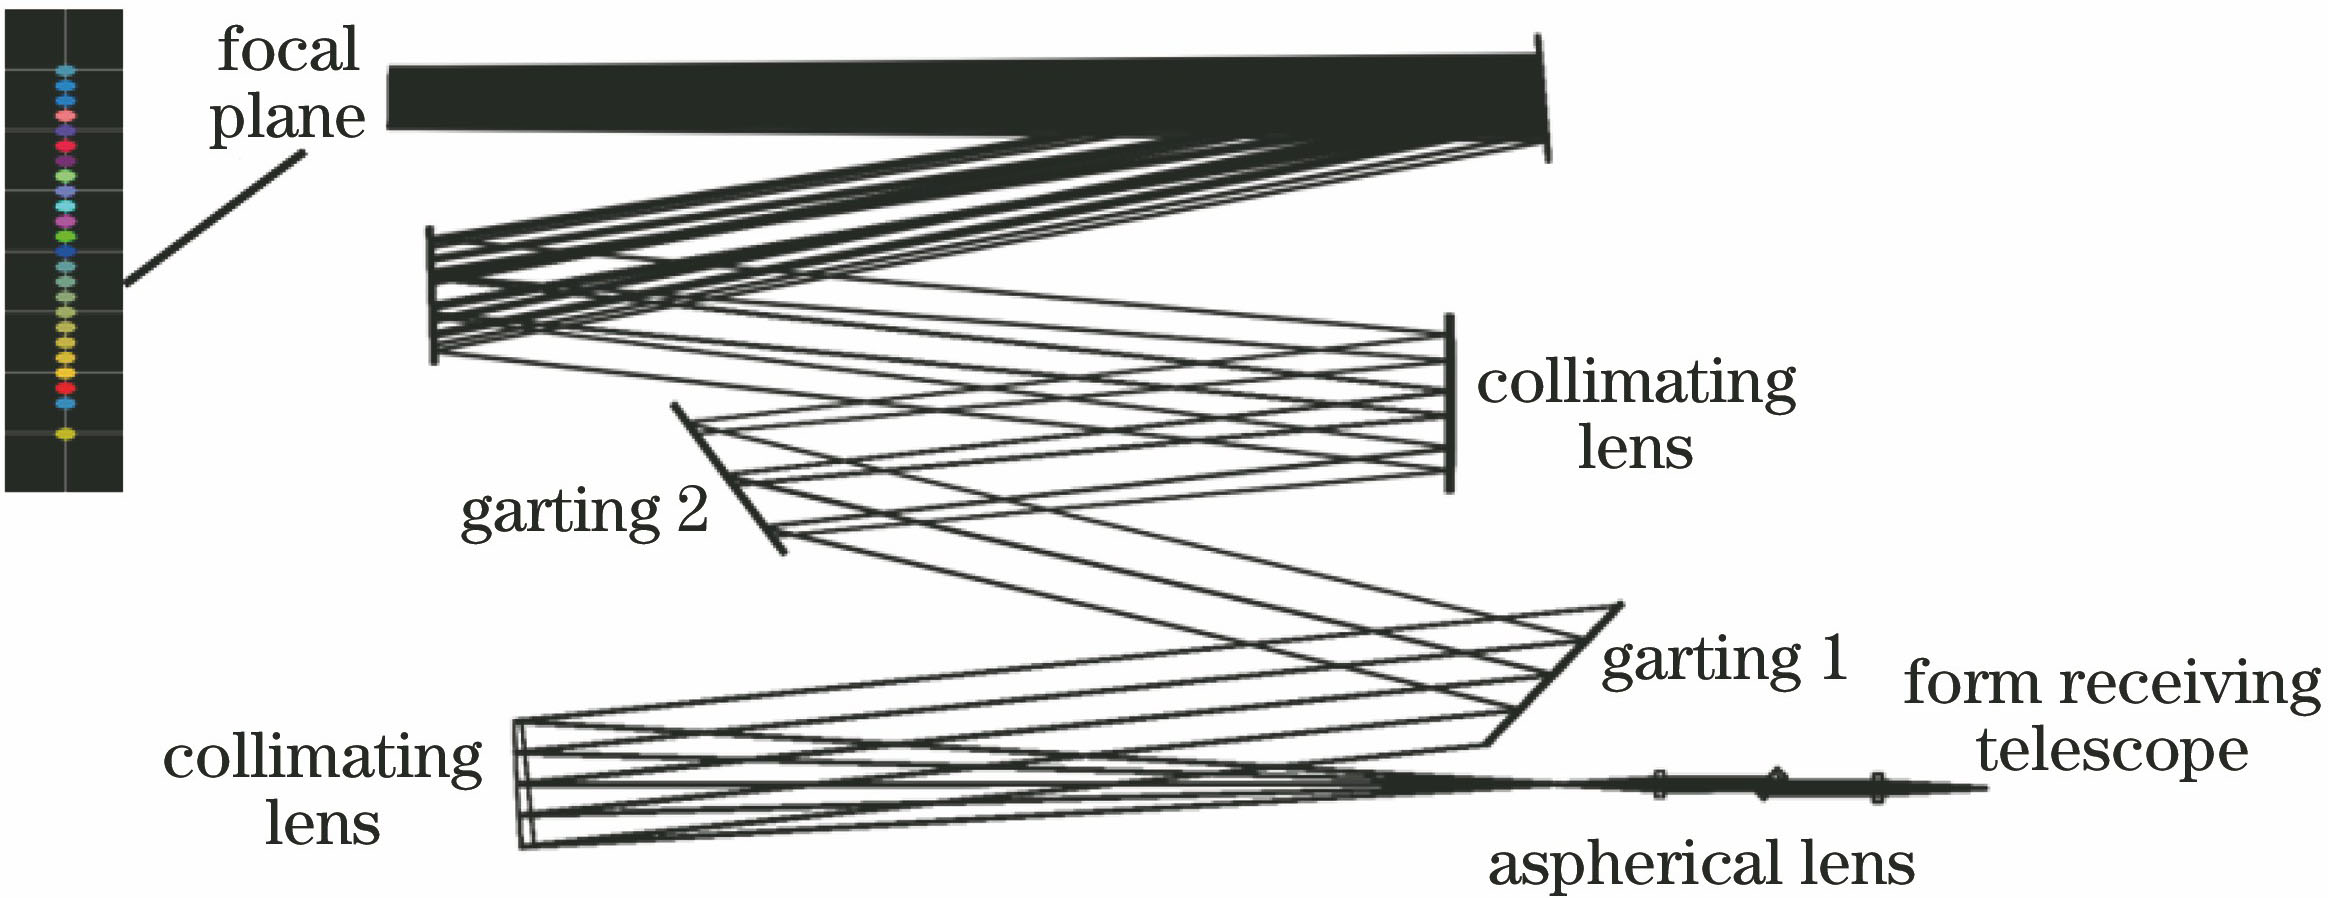
    Fig. 2. Structure diagram of temperature measuring pure rotational Raman laser lidar double gratings spectrophotometer
    Relationship between height of optical fiber image and incident angle of gratings
    Fig. 3. Relationship between height of optical fiber image and incident angle of gratings
    Imaging deviations in center and edge of pure rotational Raman spectral lines. (a) Center of spectral line; (b) edge of spectral line
    Fig. 4. Imaging deviations in center and edge of pure rotational Raman spectral lines. (a) Center of spectral line; (b) edge of spectral line
    Spot diagrams at different spectral lines. (a) Single temperature measuring pure rotational Raman line; (b) 3 adjacent temperature pure rotational Raman spectral lines; (c) 24 pure rotational Raman spectral lines
    Fig. 5. Spot diagrams at different spectral lines. (a) Single temperature measuring pure rotational Raman line; (b) 3 adjacent temperature pure rotational Raman spectral lines; (c) 24 pure rotational Raman spectral lines
    Temperature measuring lidar of double gratings spectrophotometer
    Fig. 6. Temperature measuring lidar of double gratings spectrophotometer
    Comparison of measured data and backscattering intensity of N2 for temperature measuring lidar.(a) Temperature measuring pure rotational Raman echo signal; (b) comparison between measured data and theoretical calculation of N2
    Fig. 7. Comparison of measured data and backscattering intensity of N2 for temperature measuring lidar.(a) Temperature measuring pure rotational Raman echo signal; (b) comparison between measured data and theoretical calculation of N2
    ParameterValues
    Spectral region /nm353.8-356.5
    Spectrum interval /nm0.1
    Gratings line density /(line·mm-1)3600
    Object height /mm0.4
    Imaging width /mm≤0.8
    Adjacent spectral line imaging interval /mm1
    Grating diffraction angle /(°)50
    Line dispersion /(nm·mm-1)0.1
    Table 1. Design parameter table of double gratings spectrometer
    Liu Yang, Zhang Tianshu, Zhao Xuesong, Zhong Liujun, Fu Yibin, Chen Zhenyi, Dong Yunsheng, Fan Guangqiang. A Temperature Measuring Lidar Double Gratings Spectrometer with High Linear Dispersion[J]. Chinese Journal of Lasers, 2018, 45(9): 911015
    Download Citation