• Acta Photonica Sinica
  • Vol. 49, Issue 11, 200 (2020)
Lu LI1、2、3、4, Peng ZHUANG1、2、3、*, Chen-bo XIE1、2、3, Bang-xin WANG1、2、3, and Kun-ming XING1、2、3
Author Affiliations
  • 1Key Laboratory of Atmospheric Optics, Anhui Institute of Optics and Fine Mechanics, Hefei Institutes of Physical Science, Chinese Academy of Sciences, Hefei23003, China
  • 2Science Island Branch of Graduate School, University of Science and Technology of China, Hefei3006, China
  • 3Advanced Laser Technology Laboratory of Anhui Province, Hefei2007, China
  • 4West Anhui University, Faculty of Mechanical and Automotive Engineer, Lu'an, Anhui237012, China
  • show less
    DOI: 10.3788/gzxb20204911.1149016 Cite this Article
    Lu LI, Peng ZHUANG, Chen-bo XIE, Bang-xin WANG, Kun-ming XING. Calibration of FP Etalon Transmittance Curve and Wind Field Observation Based on Doppler Wind Measurement Lidar[J]. Acta Photonica Sinica, 2020, 49(11): 200 Copy Citation Text show less
    Principle of Rayleigh scattering Doppler frequency measurement
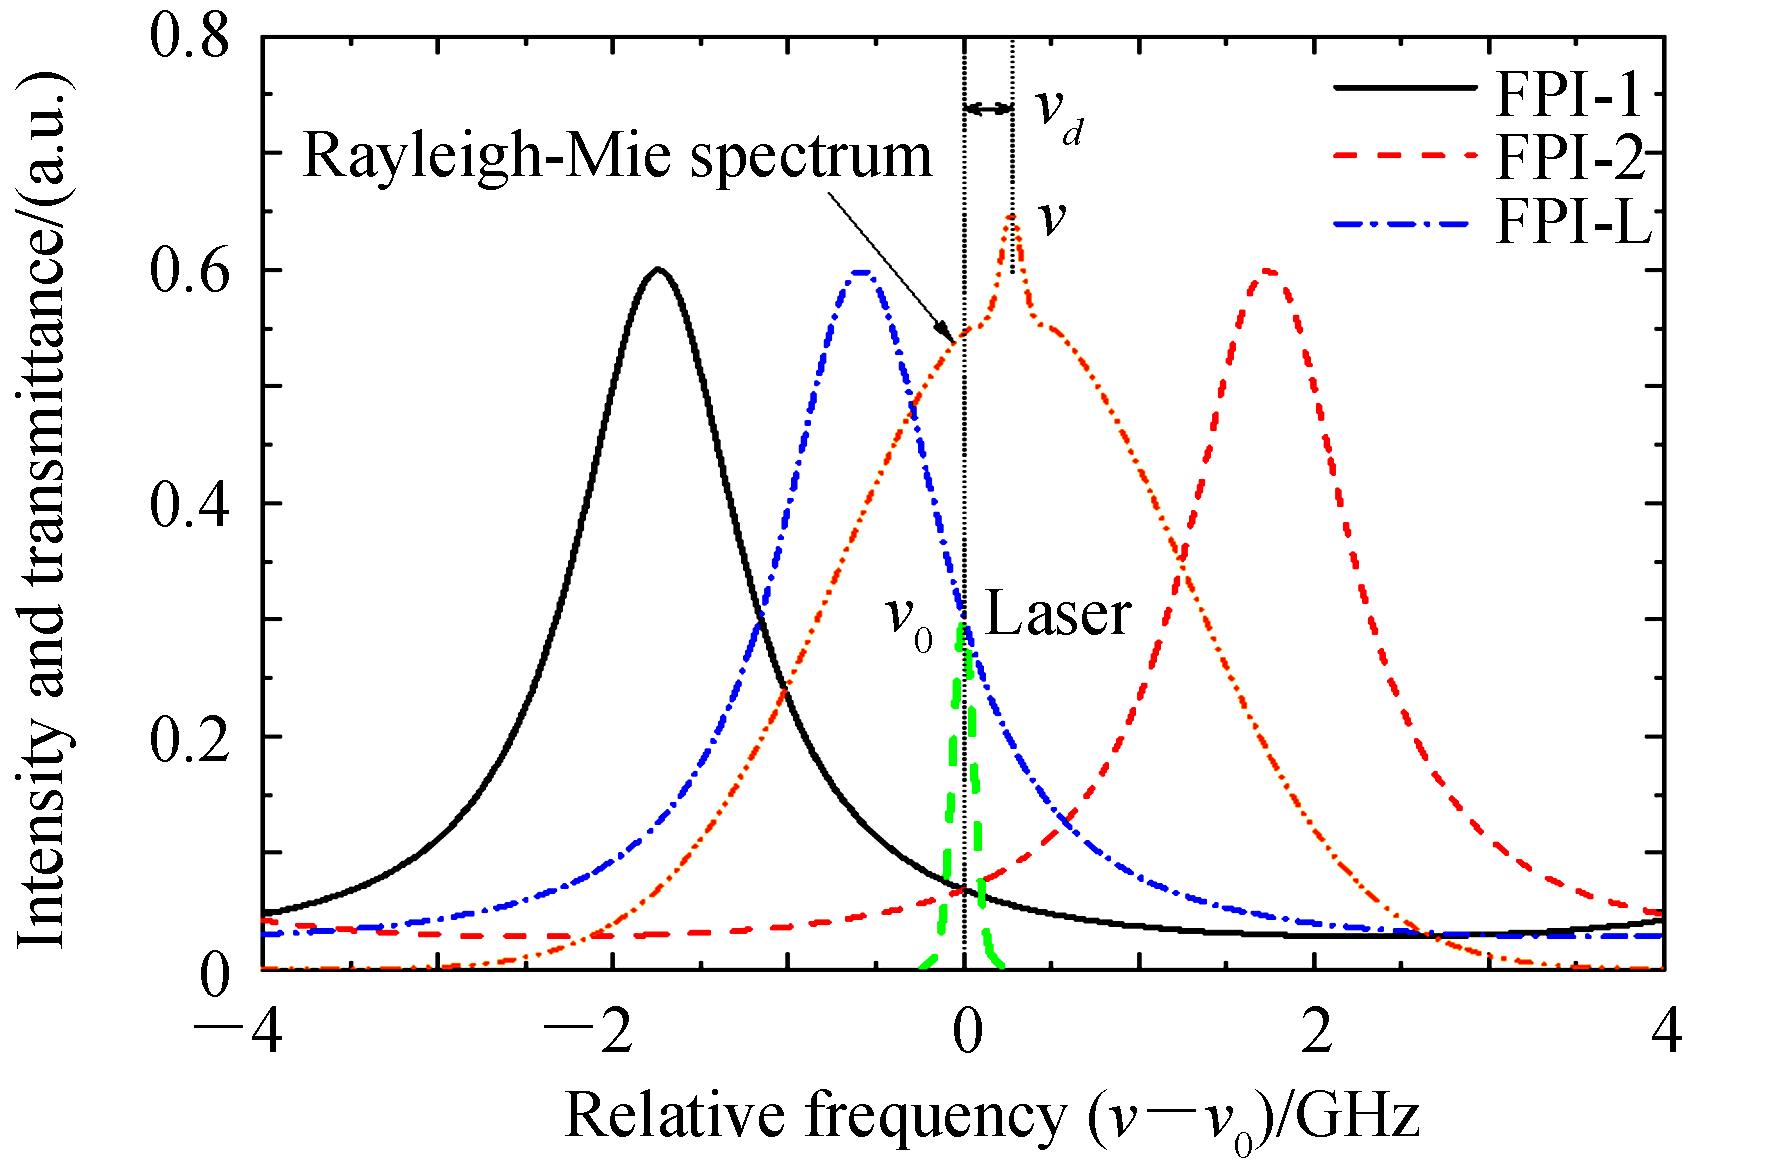
    Fig. 1. Principle of Rayleigh scattering Doppler frequency measurement
    Diagram of Doppler wind lidar receiver
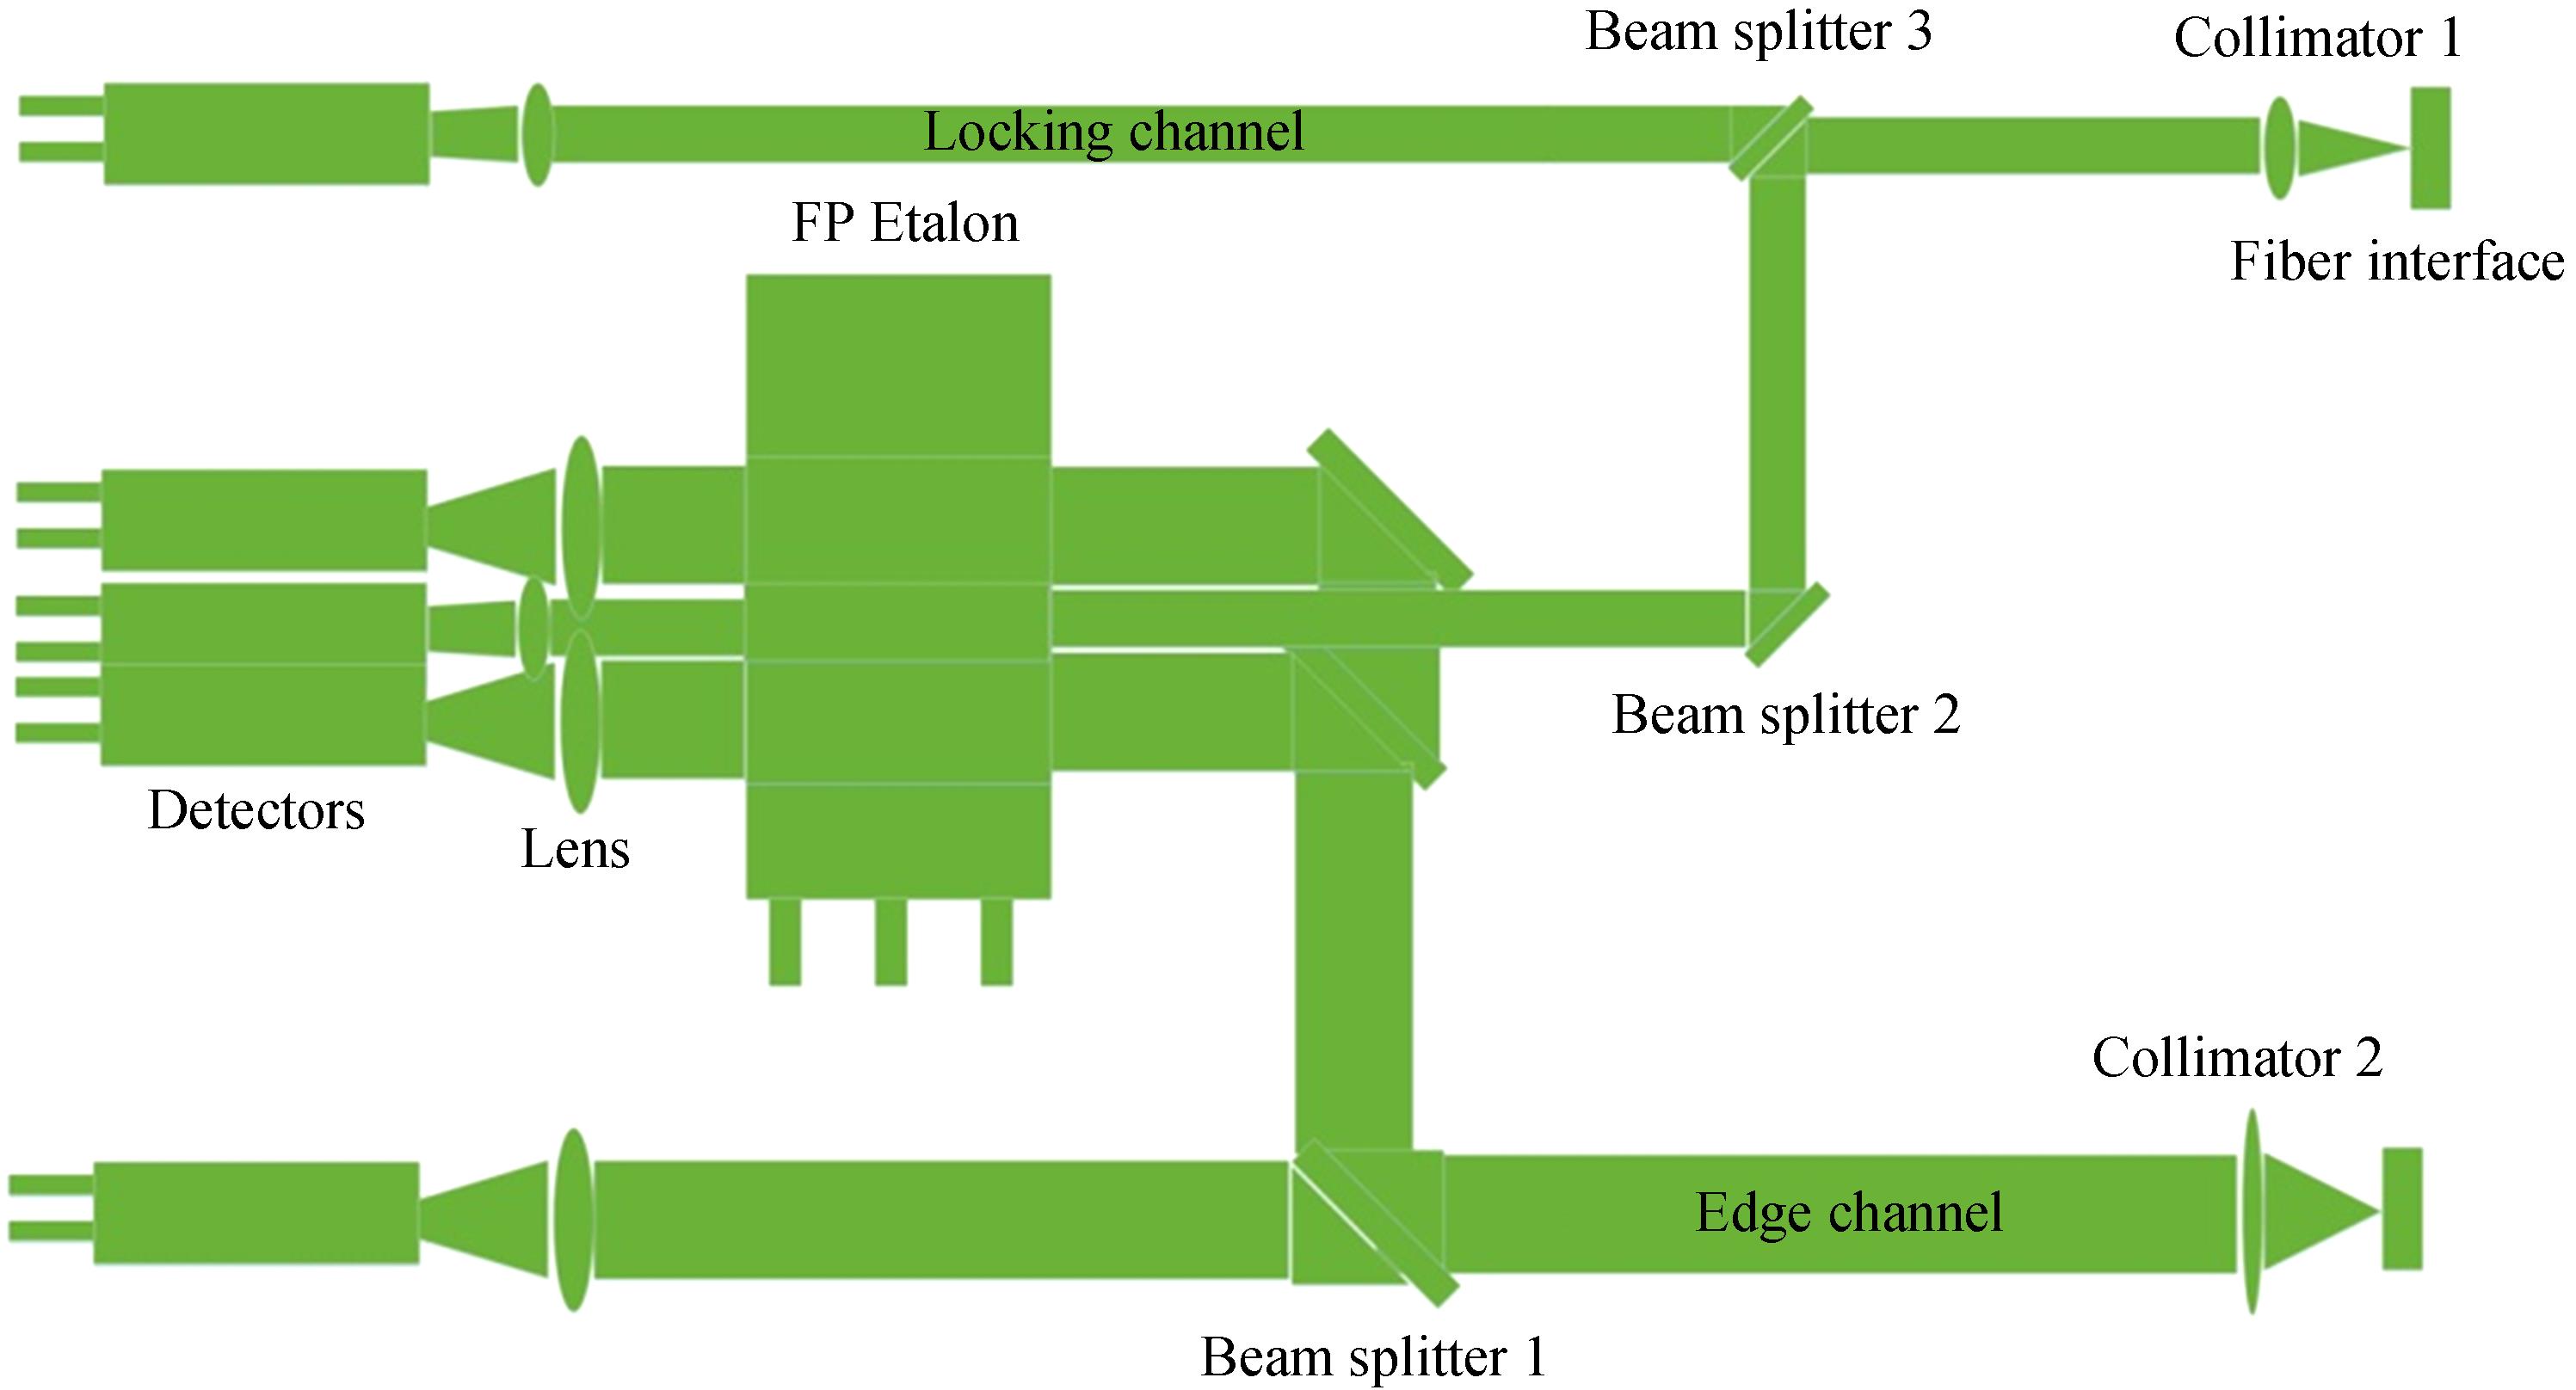
    Fig. 2. Diagram of Doppler wind lidar receiver
    FP etalon interference fringes before and after parallel
    Fig. 3. FP etalon interference fringes before and after parallel
    Flow chart of transmittance curve scanning
    Fig. 4. Flow chart of transmittance curve scanning
    Collected the pulse signal output by PMT
    Fig. 5. Collected the pulse signal output by PMT
    Transmittance curve and fitting result obtained by pulsed light scanning
    Fig. 6. Transmittance curve and fitting result obtained by pulsed light scanning
    Transmittance function of molecular scattering signal in etalon edge channel
    Fig. 7. Transmittance function of molecular scattering signal in etalon edge channel
    Photo and structure diagram of Doppler wind lidar system
    Fig. 8. Photo and structure diagram of Doppler wind lidar system
    Flow chart of wind field detection experiment
    Fig. 9. Flow chart of wind field detection experiment
    5 consecutive observations of radial wind velocity in the same direction
    Fig. 10. 5 consecutive observations of radial wind velocity in the same direction
    Measurement results of four azimuth radial wind speeds on the evening of May 18
    Fig. 11. Measurement results of four azimuth radial wind speeds on the evening of May 18
    Comparison result of wind measurement lidar system and radiosonde at 10:56 on May 12, 2020
    Fig. 12. Comparison result of wind measurement lidar system and radiosonde at 10:56 on May 12, 2020
    Comparison result of wind measurement lidar system and radiosonde at 22:36 on May 18, 2020
    Fig. 13. Comparison result of wind measurement lidar system and radiosonde at 22:36 on May 18, 2020
    The radiosonde rises to a distance of 10 km from the lidar
    Fig. 14. The radiosonde rises to a distance of 10 km from the lidar
    NameParameters

    Transmitter

    system

    Nd∶YAG Laser

    Continuum9030

    Out wavelenth/nm532
    Pulse energy/(mJ·pulse-1)800
    Pep rate/Hz30
    Pulse length/ns4~8
    Beam divergence/mrad0.5
    Receiving systemCassegrain telescopeDiameter/mm300
    Focal length/mm1 961
    Field of view/mrad0.1

    Three-channel FP

    Etalon

    ET70

    FSR/GHz7.6
    FWHM/GHz1.05
    Dual channel spectral spacing/GHz3.48
    Peak transmittance/%>60
    Diameter/mm80
    Capture cardSampling rate1 GHz/20 MHz
    optical fiberCore diameter/mm0.2(reference)/0.1(locking)
    Numerical diameter N.A.0.22
    Table 1. Parameters of Doppler wind lidar system
    Lu LI, Peng ZHUANG, Chen-bo XIE, Bang-xin WANG, Kun-ming XING. Calibration of FP Etalon Transmittance Curve and Wind Field Observation Based on Doppler Wind Measurement Lidar[J]. Acta Photonica Sinica, 2020, 49(11): 200
    Download Citation