
Bo Han, Ya-Qiong Liang. Measurement of magnetic field of capacitor-coil target using proton radiography [J]. Acta Physica Sinica, 2020, 69(17): 175202-1
- Acta Physica Sinica
- Vol. 69, Issue 17, 175202-1 (2020)
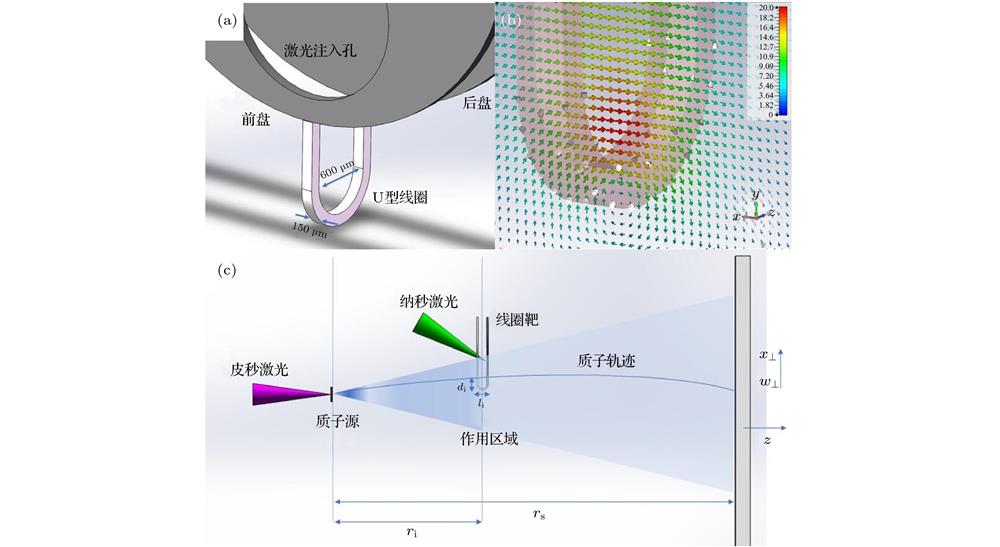
Fig. 1. (a) Configuration of capacitor-coil target; (b) schematic of magnetic field of capacitor-coil target. Pink-semitransparent is the coil, white arrows indicate the current direction, and colorful arrows indicate the magnetic field in X -Y plane; (c) experimental setup of proton radiography.
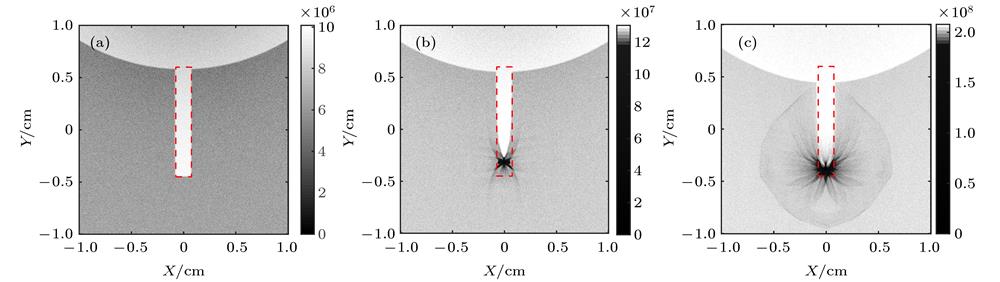
Fig. 2. Simulation results of Geant4, the coordinates are adjusted at the position of detector: (a) Coil current I = 0; (b) coil current I = 10 kA; (c) coil current I = 50 kA. The red dash regions are the position of the shadow of the coils
Fig. 3. (a) Theoretical magnetic strength for I = 10 kA; (b) theoretical magnetic strength for I = 50 kA; (c) theoretical magnetic configuration for I = 10 kA; (d) theoretical magnetic configuration for I = 50 kA. The black dash regions are the position of the shadow of the coils. The coordinates are adjusted at the position of detector
Fig. 4. (a) Reconstructed magnetic strength for I = 10 kA; (b) reconstructed magnetic strength for I = 50 kA; (c) reconstructed magnetic configuration for I = 10 kA; (d) reconstructed magnetic configuration for I = 50 kA. The black dash regions are the position of the shadow of the coils. The coordinates are adjusted at the position of detector
Fig. 5. (a) Comparison between the mean theoretical and the mean reconstructed magnetic field for the I = 10 kA case in the region of –0.15 cm < X < 0.15 cm along Y direction; (b) comparison between the mean theoretical and the mean reconstructed magnetic field for the I = 50 kA case in the region of –0.15 cm < X < 0.15 cm along Y direction. The black solid lines are the theoretical results. The red solid lines are the reconstructed line. The black dash lines are the position of the tips of the coils; (c) comparison of μ value along the Y direction between the I = 10 kA and I = 50 kA cases
Fig. 6. Black solid line and scatters are the relation between current strength and the magnetic flux density at the top of the nickel coil. The colorful solid line and scatters are the corresponding μ values when proton energy is 1, 4, 7.5 and 10 MeV, respectively


Set citation alerts for the article
Please enter your email address

© Copyright 2018-2021 | Chinese Laser Press. All Rights Reserved 沪ICP备15018463号-20