Abstract
An aberration-free imaging technique was used to design a double-spherically bent crystal spectrometer with high energy and spatial resolutions to ensure that the individual spectral lines are represented as perfectly straight lines on the detector. After obtaining the matched parameters of the two crystals via geometry-based optimization, an alignment method was employed to allow the spacing between the crystals and the detector to be coupled with the source. The working principle of this spectrum-measuring scheme was evaluated using a Cu X-ray tube. High-quality spectra with energy resolutions (E/ΔE) of approximately 3577 were obtained for a relatively large source size.X-ray spectra of laser-produced plasmas (LPPs) have been intensively investigated[1–5]. The X-ray emission spectra from LPPs have been routinely measured using crystal spectrometers with both energy and spatial resolutions[6–9]. Measurements of temperature and density of high-temperature plasma with crystal analyzers have been increasingly embraced by researchers who seek to study radiation-sensitive resonance lines along with the adjacent weaker lines, i.e., the intercombination line, and a blend of multi-electronic satellites. To fulfill this goal, it is necessary to increase the luminosity of the spectrometers without degrading the energy resolution. It is well known that the focusing spectrograph is capable of recording highly resolved spectra with a significantly higher sensitivity[10–12]. As an example of such a device, the Johann configuration spectrometer[13,14] can obtain a high luminosity, good spatial resolution, and slightly lower spectral resolution, and has been used from the source on the Rowland circle experiments. In a von Hamos crystal spectrometer setup[15] the energy resolution depends on the size of the effective source. Sinars et al.[16] indicated that the spherically bent crystal focusing spectrometers with a one- or two-dimensional spatial resolution can be used to obtain spectra with for small sources from laser and exploding-wire plasmas. But one challenge for adapting and optimizing the instrument from the laser fusion field is the μm-scale high spatial resolution required to resolve the mm-scale plasmas and X-ray sources generated by laser facilities. In a conventional X-ray spectral measurement of a spherically bent crystal, the source and the detector are both positioned on a Rowland circle. The energy resolution recorded by a detector located on the Rowland circle is not dependent on the size of the source, whereas the spatial resolution is dramatically reduced with a large-sized source. Typically, in laser fusion research, significantly large targets and a detector that is located outside the Rowland circle are required. As a result, the energy resolution may be reassessed. In this study, we describe a double-spherically bent crystal spectrometer (DSBCS) with high energy and spatial resolutions to obtain X-ray spectra emitted from a large-sized source. The following features were considered in the proposed spectrometer design: ability to generate significant dispersion when the device is located far from the target, very low background signals, and high-quality spectral lines (e.g., perfectly straight or not-deformed lines[17]). Nevertheless, the spatial resolution perpendicular to the dispersion plane of the proposed spectrometer is primarily dependent on the degree of optical aberrations of the spherically bent crystals and the accuracy of the spectrometer alignment. This spatial resolution was optimized by Bragg reflection aberration-free imaging on two spherically bent crystals. It was shown that this scheme provided a better spatial resolution at a moderate lowering of luminosity and selected the resonant line of interest that was registered by the detector.
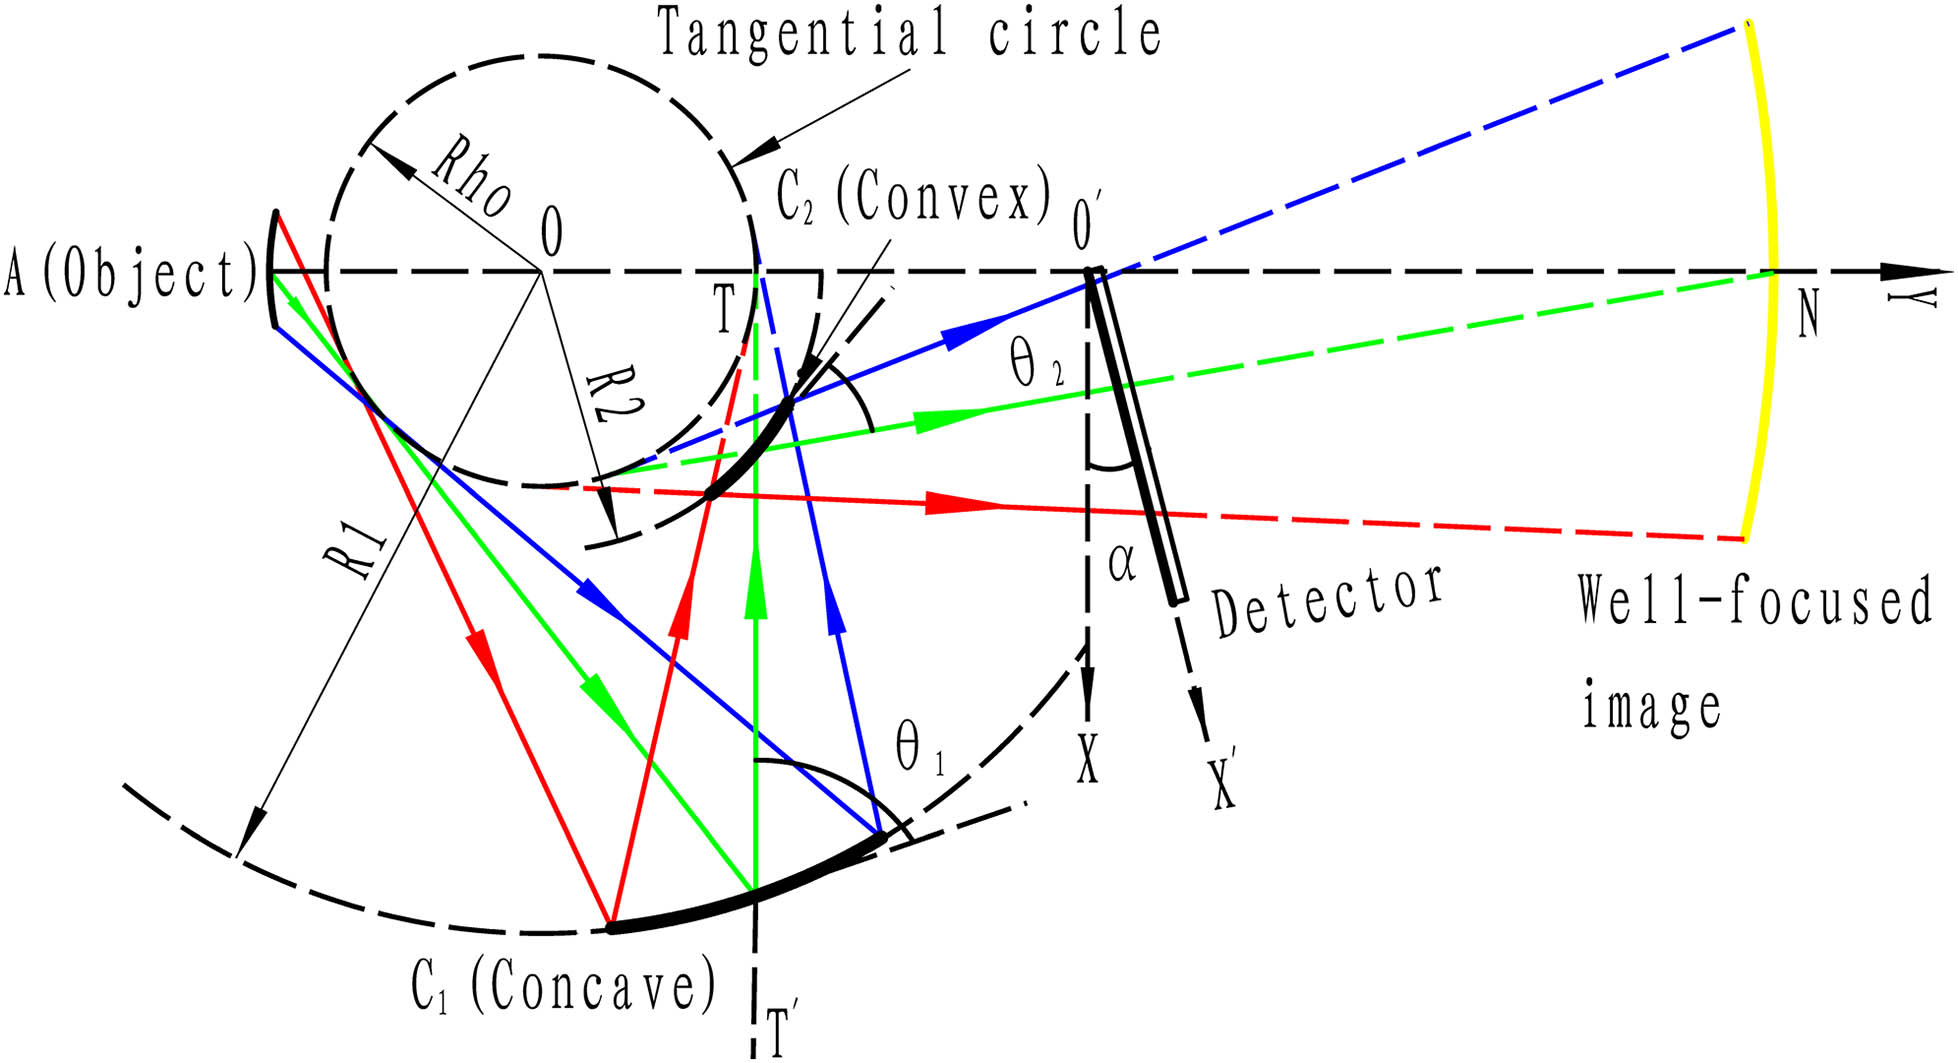
A schematic of the DSBCS design is shown in Fig. 1, where C1 and the radius of curvature R1, as well as C2 and the radius of curvature R2, are the characteristics of the primary concave mirror and secondary convex mirror, respectively. We define the primary ray with central wavelength to be one that lies in a plane perpendicular to the diffraction planes of both crystals and contains the source. X rays of wavelength from the emitting source are incident on the first crystal at the Bragg angle and are then reflected toward the second crystal. Thereafter, the X rays of wavelength diffracted from the first crystal are incident on the second crystal at the Bragg angle . Finally, the X rays are further diffracted and recorded on the detector. The DSBCS employs two concentric spherical mirrors, as shown in Fig. 1. It utilizes the focusing aspects of the spherical mirror configuration and Bragg crystal X-ray diffraction and simultaneously satisfies the following conditions. The main properties of the spherically bent crystal can be explained using two mutually independent perpendicular planes: (1) a horizontal, meridional, or dispersive plane, and (2) a vertical, sagittal, or focusing plane. The optical system was designed to minimize astigmatic aberrations of the concave primary mirror and convex secondary mirror, and then constitutes the basis for a new high-resolution instrument. The appropriately matched condition of the two spherically bent crystals can be written as . The reflected meridional rays are tangential to a tangential circle of radius about the center of curvature for the two crystals. In this way, it is possible to obtain stigmatic imaging for an almost arbitrary Bragg angle . This design was meant to improve the spatial resolution in a direction perpendicular to the main diffraction plane, i.e., the plane with three significant circles, namely C1, C2, and tangential circle, that share the same center. Because and are respectively dependent on the lattice spacing of the crystals and the wavelength of the incident X ray, the matched condition can be satisfied by choosing appropriate R1/R2 for the same wavelength of X rays. To ensure that the two crystals and the image are on the same side of the object, the Bragg angles, and , should respectively be greater than and less than . The condition consequently permits a greater flexibility of implementation of the DSBCS in experiments with limited space. Therefore, the choice of the crystals and their radii of curvature, R1 and R2, were determined by the aforementioned requirements, the constraints with respect to the available diagnostic space at the Shenguang II upgraded (SGII-up) laser facility, and the distance from the C1 (spherical concave mirror) to the X-ray source, which was chosen such that the C1 is not at risk of being damaged by debris ejected from the X-ray source. Furthermore, to compare with the more traditional flat crystal or spherically bent crystal spectrometer, we established reasonable estimates for the efficiency of our DSBCS in terms of the spectral bandpass of the system (derived from the Bragg equation). Also, it is of interest to compare the results of the spectral intensities obtained in different laser shots to assess the capabilities of our DSBCS. Although the flux reaching the detector is relatively low, this system shows promise for high-energy resolution X-ray emission spectroscopy from an extended source or high-contrast images for future developmental experiments.

Figure 1.Spectrum-measurement scheme for the double-spherically bent crystal, with Bragg angles and . The red, green, and blue lines represent the maximum and minimum grazing incidence angles from the source position for light incident at the edges of the crystal surface, and radiation hits the center of the crystals (C1 and C2) at the Bragg angles ( and ), respectively.
Although the configuration of the DSBCS is similar to the stigmatic X-ray imaging scheme used by Bitter et al.[18,19], the primary difference is that instead of the backlit image, the system detects X-ray spectra from a laser-produced extended source. The DSBCS design in which the sagittal plane (i.e., the plane perpendicular to the dispersion plane) influences the micro-level spatial resolution is primarily dependent on the aberration-free optics of the double-spherically bent crystals and the precise alignment of the spectrometer. It should be noted that such a scheme is limited by the resolution of the detector, diffraction, and other factors, such as crystal quality, perfection of the crystal form, and crystal adjustment. The optical alignment of the DSBCS with the source position was realized in three stages. First, we used two theodolites to establish an adjustable reference system that can center about Point O (center of the three circles), Point T (the tangential point of the tangential circle), and the centers of the two spherically bent crystal surfaces (see Fig. 1). The optical axis of one theodolite was aligned along the line joining Point O and Point T, and the optical axis of the other theodolite was aligned along the line joining the centers of the two spherically bent crystal surfaces that traverse through Point T and are perpendicular to the line joining Point O and Point T (see axes A-N and T-T’ in Fig. 1). Then, the angles and distances of the two spherically bent crystals and the detector were set according to the results of the ray-tracing program for each experiment. The overall accuracy of alignment was evaluated using a theodolite visible laser with various analogies between the reflections of the X-ray radiation and visible light. A transparent foil with orthogonal lines was positioned as an object at Point A (see Fig. 1), while a theodolite visible laser source was placed in front of the object. When the detector was removed, an image of the object was observed on a white screen that was positioned at Point N (see Fig. 1). At this stage, it was necessary to obtain an image of the lines on the plane of the white screen that was as undistorted as possible.
Sign up for Chinese Optics Letters TOC. Get the latest issue of Chinese Optics Letters delivered right to you!Sign up now
The practicality of the DSBCS was tested by using a water-cooled X-ray tube source. In the experiment, the crystal, source, and detector were positioned according to the DSBCS scheme described above. The matched pair of spherically bent crystals comprised the crystals with one concave Si (533) spherical mirror (C1) with a 2d-spacing of and a radius of , and one convex -quartz spherical mirror (C2) with a 2d-spacing of and a radius of . The radius of the tangential circles was , and the theoretically expected magnification (M) was approximately 1.95. C1 was placed 717. 3 mm from a Cu X-ray tube source with a nominal spot size of approximately 1.0 mm. The distance between the centers of crystal surface C1 and C2 was 382.8 mm. Note that the Bragg condition will only be satisfied for the special pair of Bragg angles, and (cf. Fig. 1). As the distance between the detector and crystals can be optimally determined based on the results of the ray-tracing program, according to the requirements of the energy resolution in the experiment, an image plate (IP) was appropriately chosen to locate the position indicated in Fig. 1. The actual distance between IP and the center of the C2 crystal surface was measured as 350 mm instead of the well-focused image. The detector was inclined at an angle , measured with respect to the double-spherically bent crystal center-diffracted line, which was perpendicular to the X′ coordinate (e.g., the recording surface direction of the detector). The X coordinate was perpendicular to the axis A-N, so that the corresponding line coincided with the Y coordinate. The X coordinate 0, with located point on the axis line A-N, was the problem’s independent variable. The X-ray tube was operated at 20 mA and 30 kV. The IP was exposed for a period of 30 min to collect the appropriate intensity for high-contrast images and then read by a Fuji IP scanner[20] with the following user settings: sensitivity S4000, latitude L5, and a scan resolution with an R25-μm pixel spacing.
Figure 2(a) shows the raw spectral lines as perfectly straight lines, as recorded by the IP. The undistorted astigmatic image lines indicate that the two planes have almost the same spatial resolution. The spectra derived by column-summing the pixel values are shown in Fig. 2(b), and the IP position converted to the photon energy E (keV) scale was then applied using reference lines as standards for the wavelength calibration. We made use of the peak positions of the and –lines of Cu, which were observed as the brightest part for each spectrum, as choosing the reference lines, and then derived the energy dispersion calibration. To determine the full width at half-maximum (FWHM) of the distribution function of the spectral intensity, the experimental data were fitted based on the Gaussian function. The calculated FWHM from the fit of the peak intensity of the Cu line was approximately 2.25 eV. Here, the energy resolution is defined by the FWHM value given by the distribution of the transmitted monochromatic power of the detector. In our DSBCS setup the observed and the theoretically predicted source sizes on the detector were in agreement within the experimental error. We infer from Fig. 2(a) that the effective source size of the X-ray tube was approximately 1.0 mm. Therefore, the measured energy resolution () of DSBCS at 8.048 keV was approximately 3577 for a lateral source size of approximately 1.0 mm.
Figure 2.DSBCS-measured spectrum of cold Cu. (a) The raw spectral data recorded by using an IP. (b) The relative intensity obtained by averaging over the photon counts in the spatial direction versus the spectral resolution.
In conclusion, we have successfully designed a DSBCS that is based on a pair of concave–convex bent crystals as an effective tool to measure the X-ray emission spectra from a spatially extended X-ray source with an extremely high spatial resolution and a several-thousand energy resolving power. Since the reflected rays from C2 are divergent, the detector can be placed at an arbitrary distance from C2 to enable optimization of the experimental arrangement with respect to the detector parameters instead of a well-focused image. An initial assessment has been made of the spectrometer performance with large extended X-ray source measurements. Spectra were recorded with an energy resolution of at 8.048 keV. It is possible to provide a high spatial resolution and excellent spectral resolving power in X-ray diagnostics of laser-produced plasma using the currently matched pair of spherically bent crystals. We also would like to once more emphasize another important advantage of our DSBCS: its large source size. Further tests of the DSBCS with an LPP radiation X-ray source are planned for the near future to obtain more detailed line-shape spectra at the SGII-up laser facility in China.
References
[1] I. Golovkin, R. Mancini, S. Louis, Y. Ochi, K. Fujita, I. Niki, H. Nishimura, I. Uschmann, R. Butzbach, E. Förster, C. Back, R. Lee, L. Klein, J. Delettrez. Rev. Sci. Instrum., 72, 1256(2001).
[2] A. L. Osterheld, W. L. Morgan, J. T. Larsen, B. K. F. Young, W. H. Goldstein. Phys. Rev. Lett., 73, 1505(1994).
[3] A. A. Lutman, M. W. Guetg, T. J. Maxwell, J. P. MacArthur, Y. T. Ding, C. Emma, J. Krzywinski, A. Marinelli, Z. R. Huang. Phys. Rev. Lett., 120, 264801(2018).
[4] Y. Tian, W. T. Wang, C. Wang, X. M. Lu, C. Wang, Y. X. Leng, X. Y. Liang, J. S. Liu, R. X. Li, Z. Z. Xu. Chin. Opt. Lett., 11, 033501(2013).
[5] H. Lan, X. B. Wang, D. L. Zuo. Chin. Phys. B, 25, 035202(2016).
[6] S. Terentyev, V. Blank, T. Kolodziej, Y. Shvyďko. Rev. Sci. Instrum., 87, 125117(2016).
[7] S. L. Xiao, H. J. Wang, J. Shi, C. H. Tang, S. Y. Liu. Chin. Opt. Lett., 7, 92(2009).
[8] S. G. Lee, J. G. Bak. Rev. Sci. Instrum., 79, 013501(2008).
[9] P. M. Nilson, F. Ehrne, C. Mileham, D. Mastrosimone, R. K. Jungquist, C. Taylor, C. R. Stillman, S. T. Ivancic, R. Boni, J. Hassett, D. J. Lonobile, R. W. Kidder, M. J. Shoup, A. A. Solodov, C. Stoeckl, W. Theobald, D. H. Froula, K. W. Hill, L. Gao, M. Bitter, P. Efthimion, D. D. Meyerhofer. Rev. Sci. Instrum., 87, 11D504(2016).
[10] R. R. Wang, H. H. An, Z. Y. Xie, W. Wang. High Power Laser Sci. Eng., 5, e32(2018).
[11] B. Yaakobi, R. E. Turner, H. W. Schnopper, P. O. Taylor. Rev. Sci. Instrum., 50, 1609(1979).
[12] X. Meng, Z. M. Yang, J. Y. Du, G. B. Fan. Chin. Opt. Lett., 17, 011202(2019).
[13] J. Weinheimer, I. Ahmad, O. Herzay, H.-J. Kunze, G. Bertschinger, W. Biel, G. Borchert, M. Bitter. Rev. Sci. Instrum., 72, 2566(2001).
[14] E. Kleymenov, J. A. van. Bokhoven, C. David, P. Glatzel, M. Janousch, R. Alonso-Mori, M. Studer, M. Willimann, A. Bergamaschi, B. Henrich, M. Nachtegaal. Rev. Sci. Instrum., 82, 065107(2011).
[15] Y. Kayser, W. Blachucki, J.-Cl. Dousse, J. Hoszowska, M. Neff, V. Romano. Rev. Sci. Instrum., 85, 043101(2014).
[16] D. B. Sinars, D. F. Wenger, K. L. Keller, G. A. Rochau, J. L. Porter. Rev. Sci. Instrum., 77, 10F327(2006).
[17] M. Bitter, K. W. Hill, P. C. Efthimion, L. Delgado-Aparicio, N. Pablant, J. Lu, P. Beiersdorfer, H. Chen. Rev. Sci. Instrum., 85, 11D627(2014).
[18] M. Bitter, K. W. Hill, L. F. Delgado-Aparicio, N. A. Pablant, S. Scott, F. Jones, P. Beiersdorfer, E. Wang, M. Sanchez del Rio, T. A. Caughey, J. Brunner. Rev. Sci. Instrum., 83, 10E527(2012).
[19] J. Lu, M. Bitter, K. W. Hill, L. F. Delgado-Aparicio, P. C. Efthimion, N. A. Pablant, P. Beiersdorfer, T. A. Caughey, J. Brunner. Rev. Sci. Instrum., 85, 11D604(2014).
[20] S. Busold, K. Philipp, A. Otten, M. Roth. Rev. Sci. Instrum., 85, 113306(2014).