• Journal of Natural Resources
  • Vol. 35, Issue 11, 2674 (2020)
Meng-yao HAN1、2、3, Jiao XIONG1、2、3、4, and Wei-dong LIU1、2、3、*
Author Affiliations
  • 1Institute of Geographic Sciences and Natural Resources Research, CAS, Beijing 100101, China
  • 2Key Laboratory of Regional Sustainable Development Modeling, CAS, Beijing 100101, China
  • 3College of Resources and Environment, University of Chinese Academy of Sciences, Beijing 100049, China
  • 4School of International Trade and Economics, Central University of Finance and Economics, Beijing 100081, China
  • show less
    DOI: 10.31497/zrzyxb.20201109 Cite this Article
    Meng-yao HAN, Jiao XIONG, Wei-dong LIU. China's cross-border energy relations between direct trade and embodied transfers: Based on "the Belt and Road" energy cooperation[J]. Journal of Natural Resources, 2020, 35(11): 2674 Copy Citation Text show less
    Direct energy trade structures between China and "the Belt and Road" countries
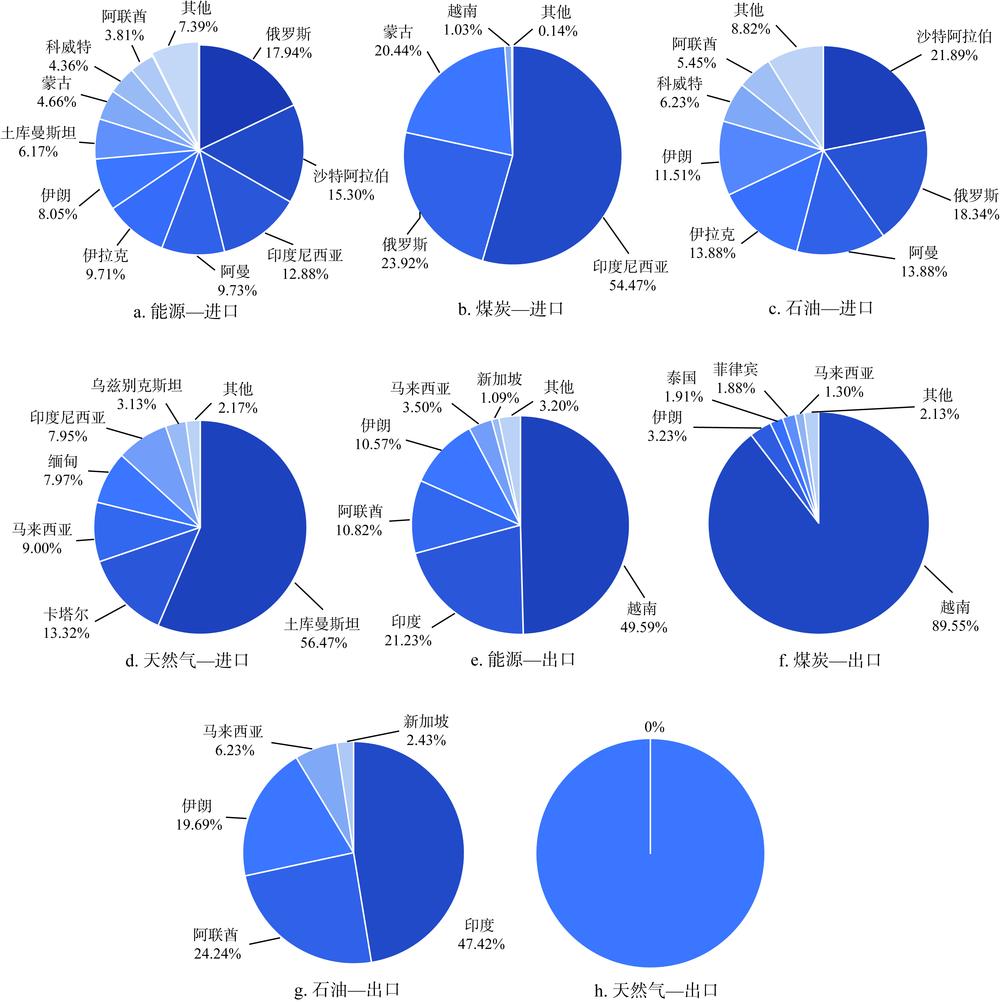
    Fig. 1. Direct energy trade structures between China and "the Belt and Road" countries
    Embodied energy transfer structures between China and "the Belt and Road" countries
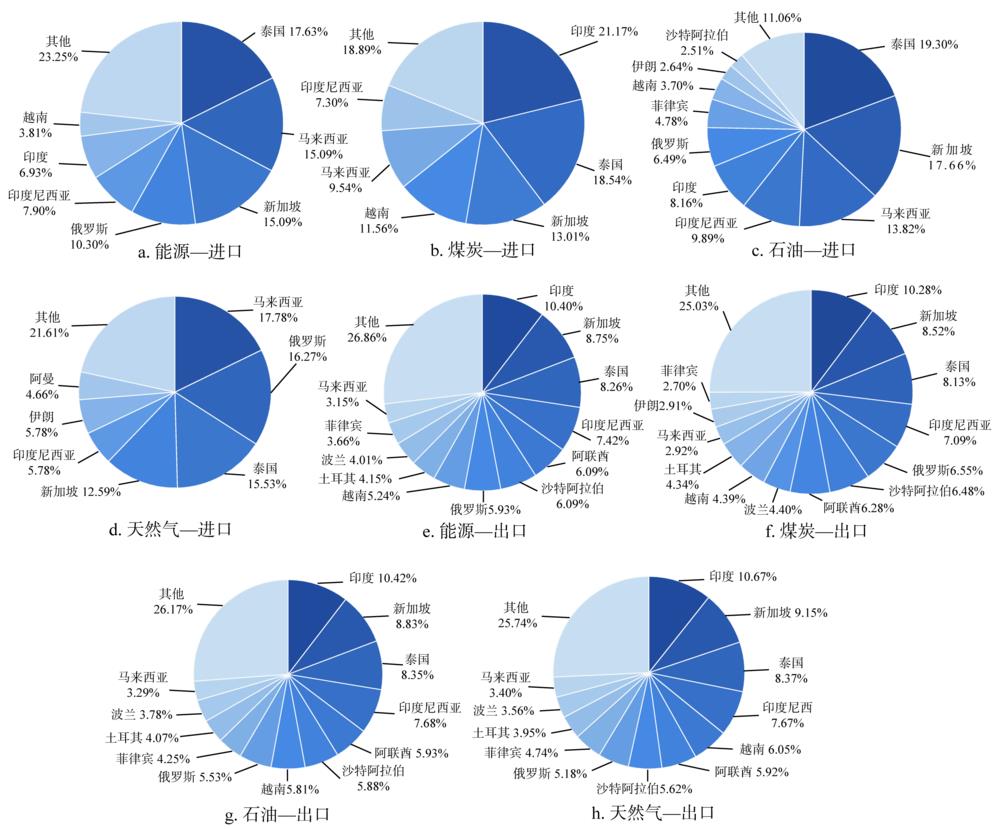
    Fig. 2. Embodied energy transfer structures between China and "the Belt and Road" countries
    Energy import/export distribution between China and "the Belt and Road" countries
    Fig. 3. Energy import/export distribution between China and "the Belt and Road" countries
    投入产出
    中间使用最终使用总产出
    区域1区域m区域1区域m
    部门1部门n部门1部门n
    区域1部门1zijrsfirsxir
    部门n
    区域m部门1
    部门n
    增加值vir
    能源投入dir
    Table 1. Input-output structure
    区域直接能源贸易隐含能源流动从贸易到消费
    进口出口进口出口进口出口
    中东欧00331.412976.49331.412976.49
    中亚26798.140.02314.4920527112.63205.02
    蒙俄74721.000.381531.901569.8076252.901570.18
    南亚0449.821348.823758.241348.824208.06
    东南亚52032.011212.608951.819216.0660983.8210428.66
    西亚中东177101.86454.471701.817151.97178803.687606.44
    合计330653.012117.2914180.2424877.56344833.2626994.85
    全球占比/%60.4727.1831.3519.8758.7220.30
    Table 2. Input-output structure
    区域煤炭石油天然气
    进口出口进口出口进口出口
    东南亚39706.914800.108954.404093.0712334.311530.31
    蒙俄31088.39746.7543995.41608.941169.66211.25
    南亚307.241608.217326.232008.56325.85589.83
    西亚中东54.533246.28172594.103313.676155.181050.41
    中东欧38.071381.85145.561178.20147.75417.00
    中亚59.1298.505,077.9679.2621975.9327.44
    合计71254.2711881.69238093.6711281.6942108.683826.24
    全球占比/%41.8219.7066.1420.8768.2520.57
    Table 3. [in Chinese]
    贸易模式贸易类型贸易比例典型国家能源类型
    直接能源驱动能源进口≥10俄罗斯、沙特阿拉伯、印度尼西亚石油为主
    煤炭为主
    5~10阿曼、伊拉克、伊朗、土库曼斯坦石油为主
    天然气
    <5蒙古、科威特、阿联酋煤炭为主
    石油为主
    能源出口越南印度、阿联酋、伊朗煤炭为主石油为主
    隐含能源驱动能源出口≥10印度煤炭和石油为主
    5~10新加坡、泰国、印度尼西亚、沙特阿拉伯、阿联酋、俄罗斯、越南
    <5土耳其、波兰、菲律宾、马来西亚
    能源进口≥10泰国、新加坡、马拉西亚、俄罗斯石油及天然气为主
    5~10印度尼西亚、印度
    <5越南、伊朗、菲律宾
    Table 4. Typical energy transfer patterns between China and "the Belt and Road" countries (%)
    类别中国与“一带一路”沿线国家中国与“一带一路”沿线以外国家
    直接能源贸易隐含能源流动直接能源贸易隐含能源流动
    总体贸易模式逆差顺差逆差顺差
    贸易占比占中国能源总进口比例的58.25%占中国能源总出口比例的20.30%占中国能源总进口比例的41.75%占中国能源总出口比例的79.70%
    贸易结构进口关联度高关联度低与部分国家关联度高关联度低
    出口关联度低关联度较高关联度低关联度高
    能源类型进口能源类型以石油为主,占比69.05%;出口能源类型主要为煤炭和石油,占比在40%左右进口能源类型主要为煤炭和石油,占比分别为49.31%和40.10%;出口能源类型主要为煤炭和石油,占比均在40%左右
    典型区域东南亚:直接能源逆差,存在少量隐含能源顺差;南亚:直接能源与隐含能源均为顺差;西亚中东:直接能源呈现逆差,隐含能源呈现顺差美国:直接能源大致均衡,隐含能源逆差明显;南美:直接能源呈现逆差,隐含能源呈现顺差;非洲:直接能源呈现逆差,隐含能源呈现顺差
    Table 5. Cross-border energy relations between China and countries within and outside "the Belt and Road" region
    Meng-yao HAN, Jiao XIONG, Wei-dong LIU. China's cross-border energy relations between direct trade and embodied transfers: Based on "the Belt and Road" energy cooperation[J]. Journal of Natural Resources, 2020, 35(11): 2674
    Download Citation