
Yin ZHANG, Jun MA, Jun-hua YAN, Hao YAN, Xi-yang ZHI, Jin-nan GONG. Approximate Model of Three-dimensional Clouds Multiple Scattering Based on Finitely Adjacent-cloud Radiative Transfer[J]. Acta Photonica Sinica, 2020, 49(12): 180
- Acta Photonica Sinica
- Vol. 49, Issue 12, 180 (2020)
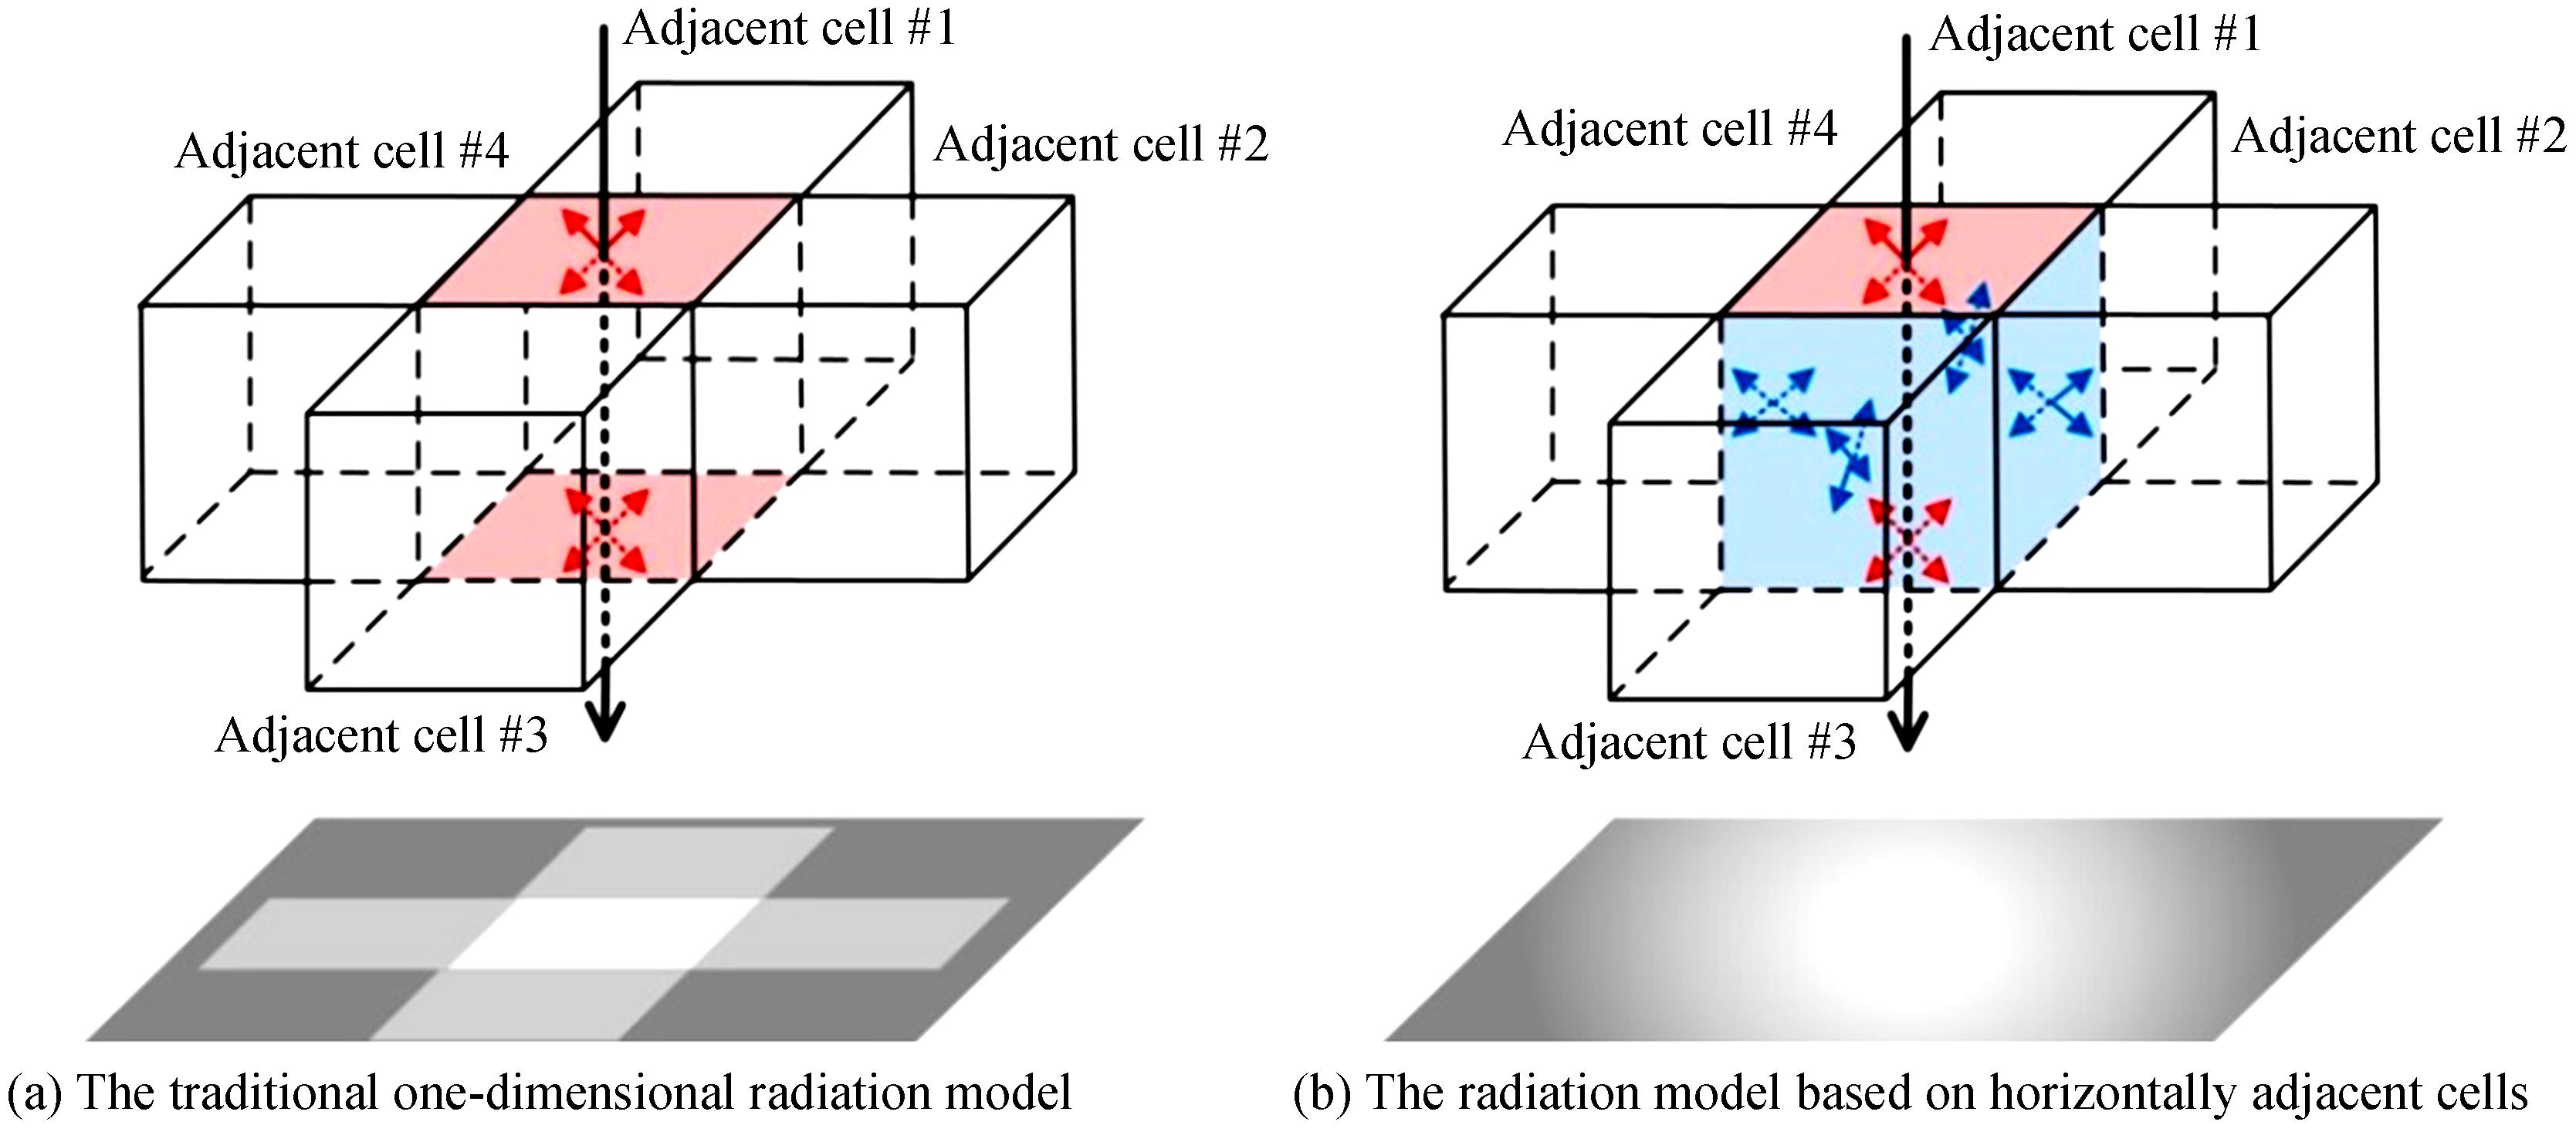
Fig. 1. Contrastive diagrams of the traditional one-dimensional radiation model and the radiation model based on horizontally adjacent cells
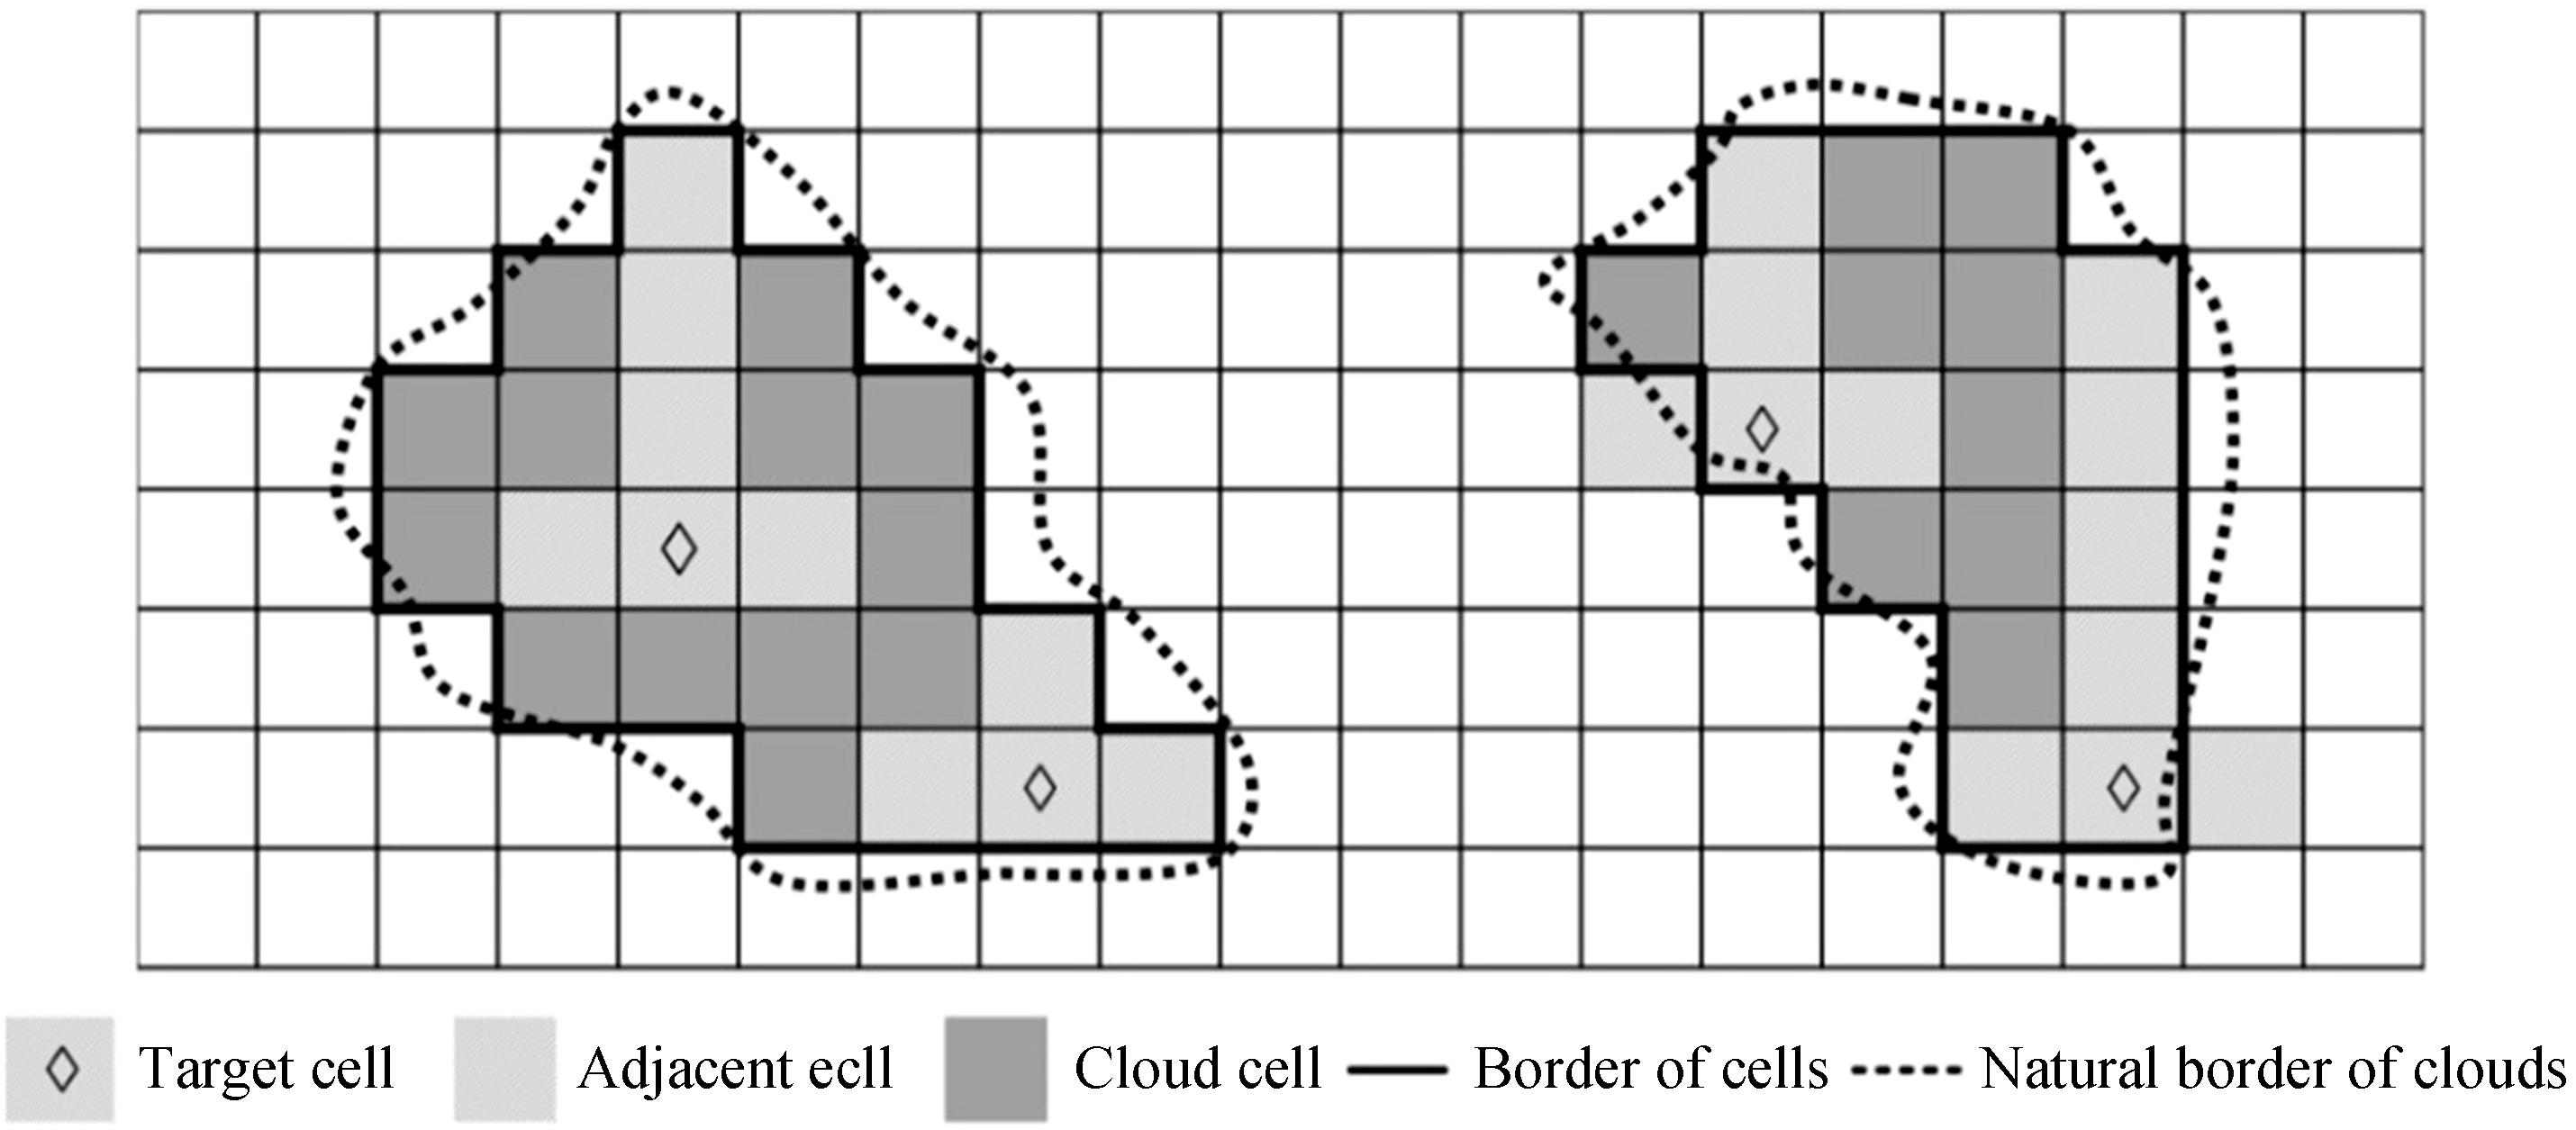
Fig. 2. Schematic diagram of finitely adjacent-cloud in a vertical section of a three-dimensional space which contained clouds
Fig. 3. Schematic diagram of position and direction for the horizontal flux density
Fig. 4. Schematic diagram of optical thicknesses for the vertically and horizontally adjacent cells
Fig. 5. Spatial distribution of extinction coefficient for three-dimensional cumulus field
Fig. 6. Spectral radiance image under observing condition U-2 at solar zenith angle 30°
Fig. 7. Spectral radiance image under observing condition D-2 at solar zenith angle 30°
Fig. 8. Mean relative errors of intensity for IPA, EMSS and the proposed model under different solar zenith angles and observing conditions
|
Table 1. Main parameters for three-dimensional cumulus field
| |||||||||||||||||||||||||||||||||||||||||||||||||||||||||||||||||
Table 2. Mean relative errors of USF and DSF for IPA, EMSS and the proposed model under different solar zenith angles
| |||||||||||||||||||||||||||||||||||||||
Table 3. Computational times of source function for IPA, EMSS, the proposed model and SHDOM under different solar zenith angles
|
Table 4. Observing conditions of the detector

Set citation alerts for the article
Please enter your email address
© Copyright 2018-2021 | Chinese Laser Press. All Rights Reserved 沪ICP备15018463号-20