
Yong ZHAO, Yueming ZHOU. Excitation and Ionization Dynamics of Atomic Rydberg States in Strong Laser Field(Invited)[J]. Acta Photonica Sinica, 2023, 52(7): 0732001
- Acta Photonica Sinica
- Vol. 52, Issue 7, 0732001 (2023)
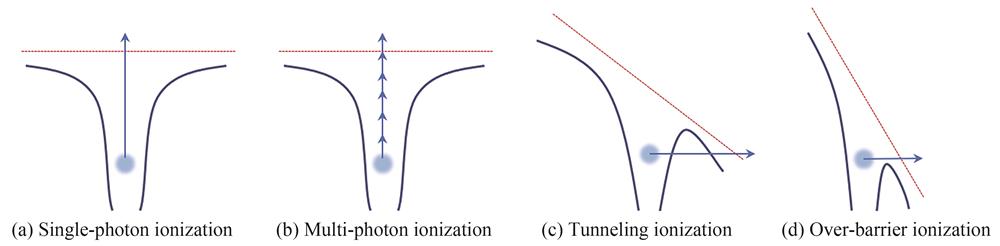
Fig. 1. Schematic diagram of the ionization mechanisms of atom in strong laser field
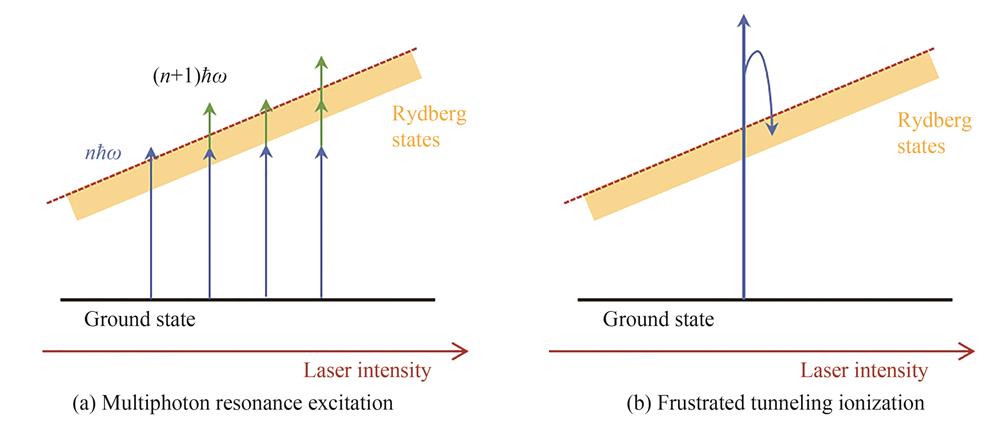
Fig. 2. Schematic diagram of two strong-field Rydberg state excitation mechanisms
Fig. 3. The ionization,excitation probabilities and photoelectron energy spectrum as a function of the laser intensity[44]
Fig. 4. Yields of singly ionized and excited Ar atoms as a function of laser intensity [78]
Fig. 5. The yield of ionized and excited He atoms as a function of the laser intensity and ellipticity[55]
Fig. 6. Measured n distribution compiling with theoretical calculations [58]
Fig. 7. Yield of strong-field excited Ar and Ne atoms as a function of the laser intensity. The Keldysh γ parameter for argon is shown on the upper x axis[82]
Fig. 8. The measured intensity dependence of the yields of ions Ar+ and excited atoms Ar∗and the laser wavelengths are 400 nm and 800 nm,respectively[83]
Fig. 9. Analytic curve(red line),simulations(●)and experimental data(△)for the Rydberg yield of Ar as a function of the ellipticity,and total ion yield of He+ is shown on the same plot(blue line)[84]
Fig. 10. The dependence of Mg* yield on ellipticity,and the distribution in initial tunneling coordinates[85]
Fig. 11. The yields of excited atoms as a function of the ellipticity of the laser pulses[86]
Fig. 12. Variation curves of the excitation yield with ellipticity calculated by different theoretical methods[63]
Fig. 13. Map of the principal quantum number n depending on the ionization time t0 and the initial transverse momentum P⊥ which the pulse duration is given by the number of cycles N
Fig. 14. The ionization yield,excitation yield and n distribution as a function of the laser intensity. The vertical dashed lines indicate the intensities at which the ionization channel closes. The numbers near the vertical dashed lines indicate the minimum photon number required for multiphoton ionization of H
Fig. 15. The schematic picture of the Quantum Model(QM)and the Rydberg-state population as a function of the laser intensity[90]
Fig. 16. Total probability of ionization and excitation of atomic hydrogen as a function of the peak intensity[91]
Fig. 17. Calculated results of the quantum trajectory model considering scattering [92]
Fig. 18. Schematic diagram of the dynamic interference process[97],and the photoelectron spectrum for H(2p)state[102]
Fig. 19. Intensity of radiation emitted from FID as function of laser intensity obtained in experiment [127]
Fig. 20. The distribution of the principle quantum number n,excitation yield and ionization yield as a function of the laser peak intensity[128]
Fig. 21. Ionization rate for p± orbitals in right circular polarization laser field[132]
Fig. 22. Scheme for sequential ionization of few-photon ionization[137]
Fig. 23. The ionization probabilities of two initial states of hydrogen atoms as a function of the laser frequency. The vertical dashed and dashed-dotted lines indicate the two- and one-photon ionization thresholds,respectively. The laser intensity is
Fig. 24. The ionization probabilities of H Rydberg states as a function of laser intensity. The frequency of laser is

Set citation alerts for the article
Please enter your email address
© Copyright 2018-2021 | Chinese Laser Press. All Rights Reserved 沪ICP备15018463号-20