
Lei Han, Shuxia Qi, Sheng Liu, Peng Li, Huachao Cheng, Jianlin Zhao. Hybrid vector beams with non-uniform orbital angular momentum density induced by designed azimuthal polarization gradient[J]. Chinese Physics B, 2020, 29(9):
- Chinese Physics B
- Vol. 29, Issue 9, (2020)
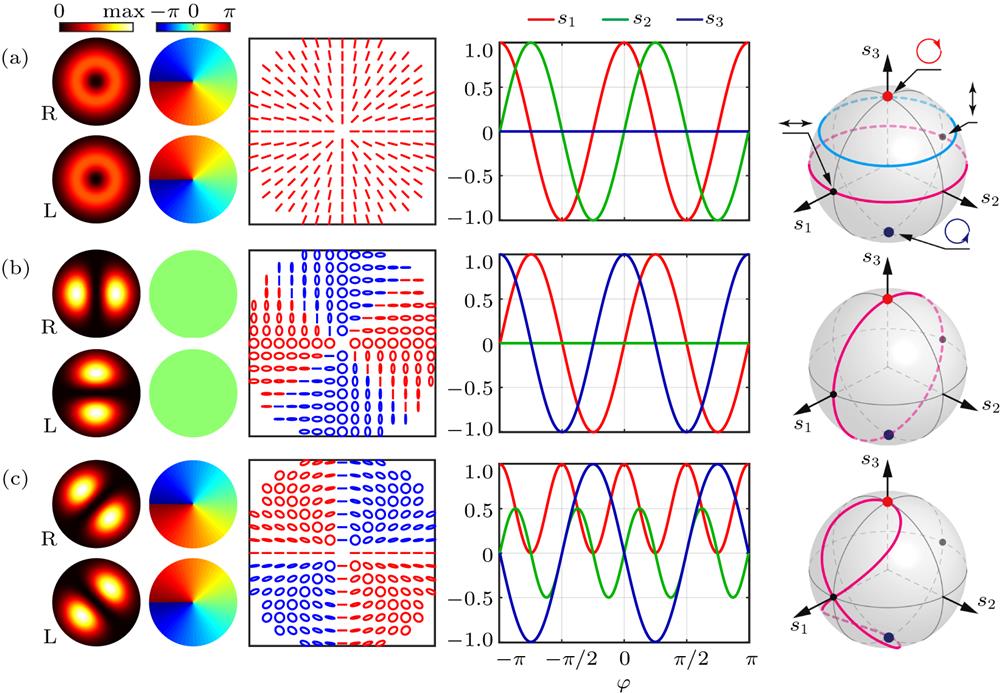
Fig. 1. Illustration of the proposed scheme under circularly polarized basis vector. The cases (0, –1, π / 4), (1, 0, 0), and (1, 1, π / 4) are presented in panels (a)–(c) in turn. The first and second columns display the intensity and phase profiles of right-(R) and left-handed (L) circular polarization states, respectively. The synthetic polarization, normalized Stokes parameters along angular direction and polarization mapping tracks on Poincaré sphere are depicted in the third to the fifth columns, respectively. The red and blue ellipses represent right- and left-handed polarization states, respectively.
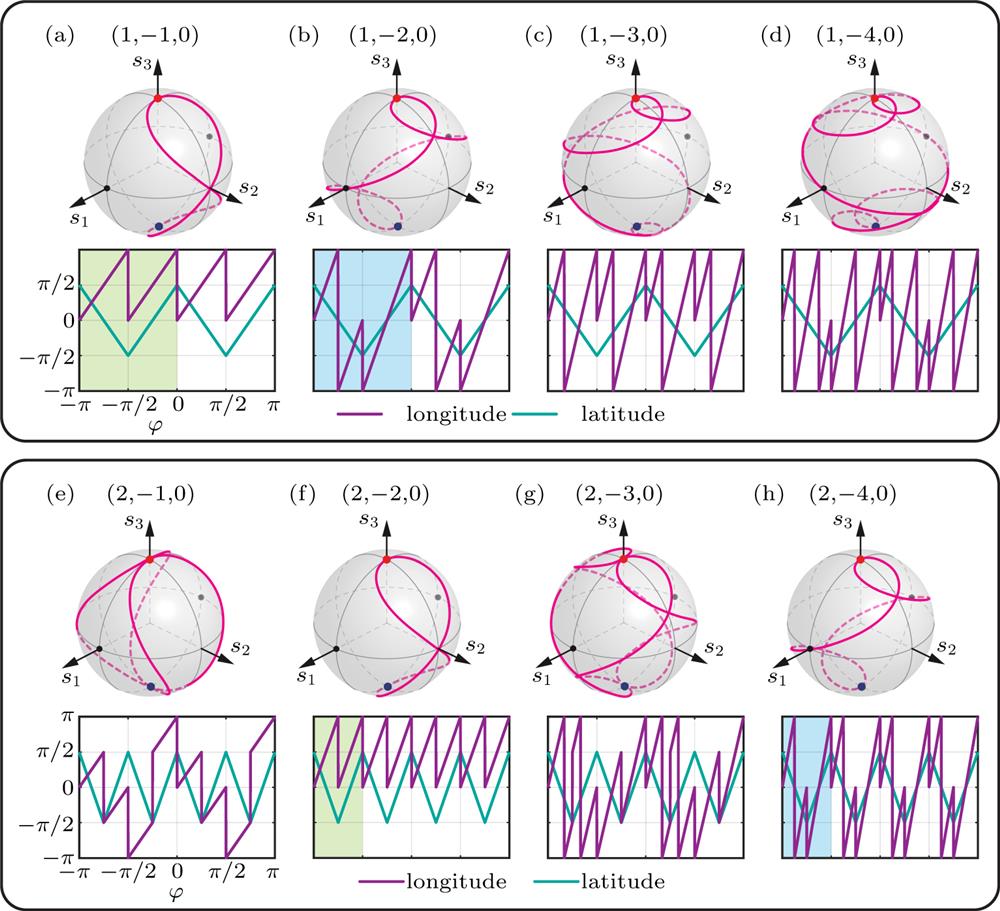
Fig. 2. Modulation effect of l and m on polarization gradient. The polarization structures, the polarization mapping tracks, and the evolution curves of longitude and latitude angles along angular direction are depicted in the first to the third rows, respectively.
Fig. 3. Hybrid vector beams under various base states. The red and blue ellipses represent right- and left-handed polarization states, respectively.
Fig. 4. Polarization structures (upper) and transverse Poynting vector patterns (lower) of hybrid vector beams with (a)–(d): (0, –1, 0), (0, –1, π / 3), (1, 1, π / 3), and (3, –1, 0) under X –Y base vectors, (e): (1, 1, π / 3) under R–L base vectors, and (f): (3, –1, 0) a pair of elliptical base vectors. The red and blue ellipses represent right- and left-handed polarization states, respectively.
Fig. 5. Experimental setup. BE: beam expansion module; HWP: half-wave plate; PBS: polarizing beam splitter; M1–M4: mirrors; RAPM: right-angle prism mirror; SLM: spatial light modulator; QWP: quarter-wave plate; L: lens; F: spatial filter; PMS: polarization measuring system; CCD: charge coupled device. Insets: (a) the computer-generated holograms and (b) the measured intensity patterns of x and y components for the case (1,0,0) on the base of X –Y basis vectors, i.e. , radial vector beam.
Fig. 6. Experimental and theoretical results for (a) (1, –2, π /4) under X –Y basis vector, (b) (2, –3, 0) under R–L basis vector, and (c) (1, –1, 0) under elliptical basis vector E p1 – E p2. The longitude and latitude of E p1 and E p2 on Poincaré sphere are (–π / 3, π / 3) and (2 π / 3, –π / 3), respectively. The measured intensity patterns of orthogonal basis vectors are shown in panels (a1)–(c1). Theoretical (left) and experimental (right) results of Stokes parameters and produced polarization structures are depicted in panels (a2)–(c2) and (a3)–(c3) in turn. The red and blue ellipses represent right- and left-handed polarization states, respectively.

Set citation alerts for the article
Please enter your email address
© Copyright 2018-2021 | Chinese Laser Press. All Rights Reserved 沪ICP备15018463号-20