• Chinese Optics Letters
  • Vol. 17, Issue 7, 070501 (2019)
Zhigang Li1, Rui Yang1, Meiyu Sun1, Jing Han1, Dengying Zhang1, Jiannong Chen1, Dawei Zhang2, and Linwei Zhu1、*
Author Affiliations
  • 1School of Physics and Optoelectronic Engineering, Ludong University, Yantai 264025, China
  • 2Engineering Research Center of Optical Instrument and System, Ministry of Education, Shanghai Key Laboratory of Modern Optical System, School of Optical-Electrical and Computer Engineering, University of Shanghai for Science and Technology, Shanghai 200093, China
  • show less
    DOI: 10.3788/COL201917.070501 Cite this Article Set citation alerts
    Zhigang Li, Rui Yang, Meiyu Sun, Jing Han, Dengying Zhang, Jiannong Chen, Dawei Zhang, Linwei Zhu. Detour phase Talbot array illuminator[J]. Chinese Optics Letters, 2019, 17(7): 070501 Copy Citation Text show less
    (a) Example of conventional TAI for a square array designed according to Eq. (1) with a fraction parameter of β=15, and (b) its reconstructed intensity distribution at the fractional distance. (c) Phase distribution within one period of the TAI and (d) its corresponding 3D multilevel steps structure.
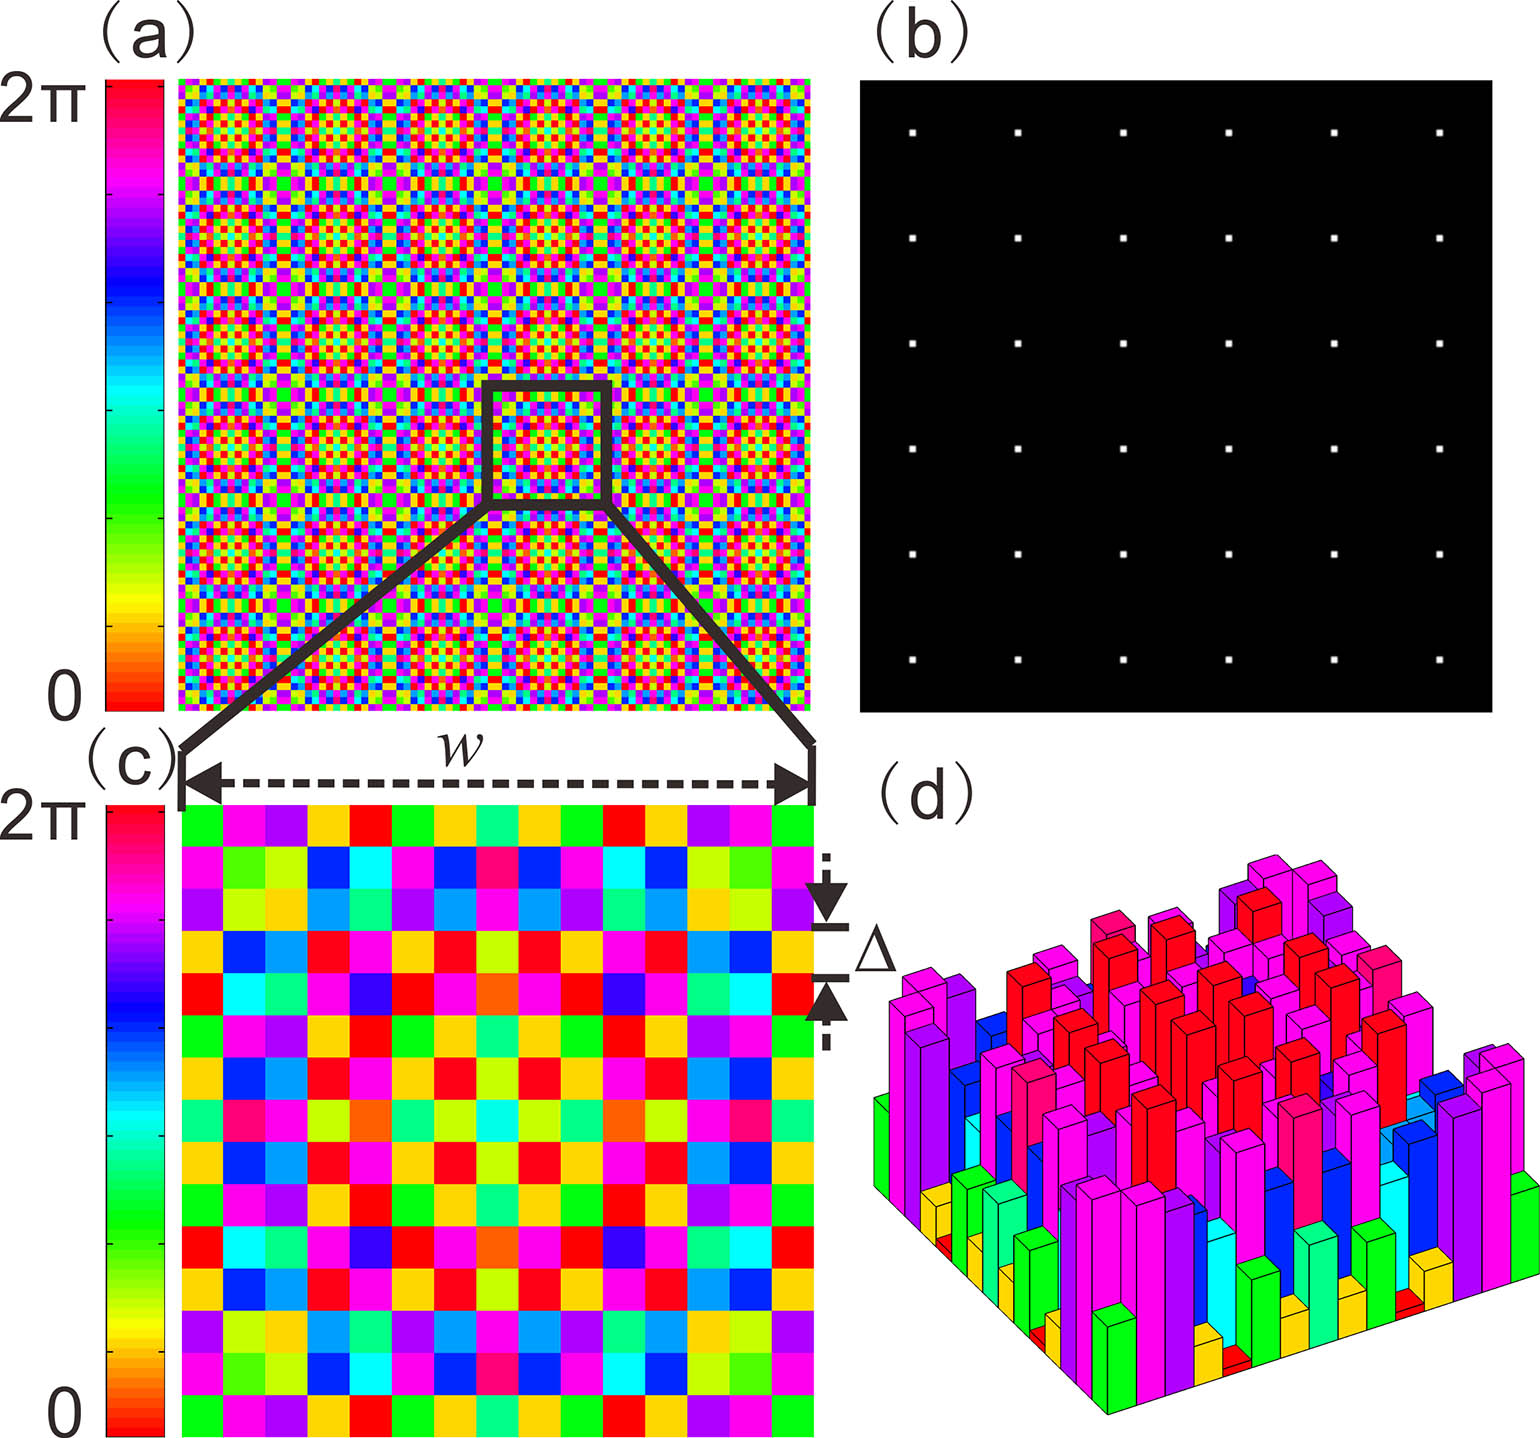
    Fig. 1. (a) Example of conventional TAI for a square array designed according to Eq. (1) with a fraction parameter of β=15, and (b) its reconstructed intensity distribution at the fractional distance. (c) Phase distribution within one period of the TAI and (d) its corresponding 3D multilevel steps structure.
    Stemplot of the phase levels as shown in Fig. 1(c).
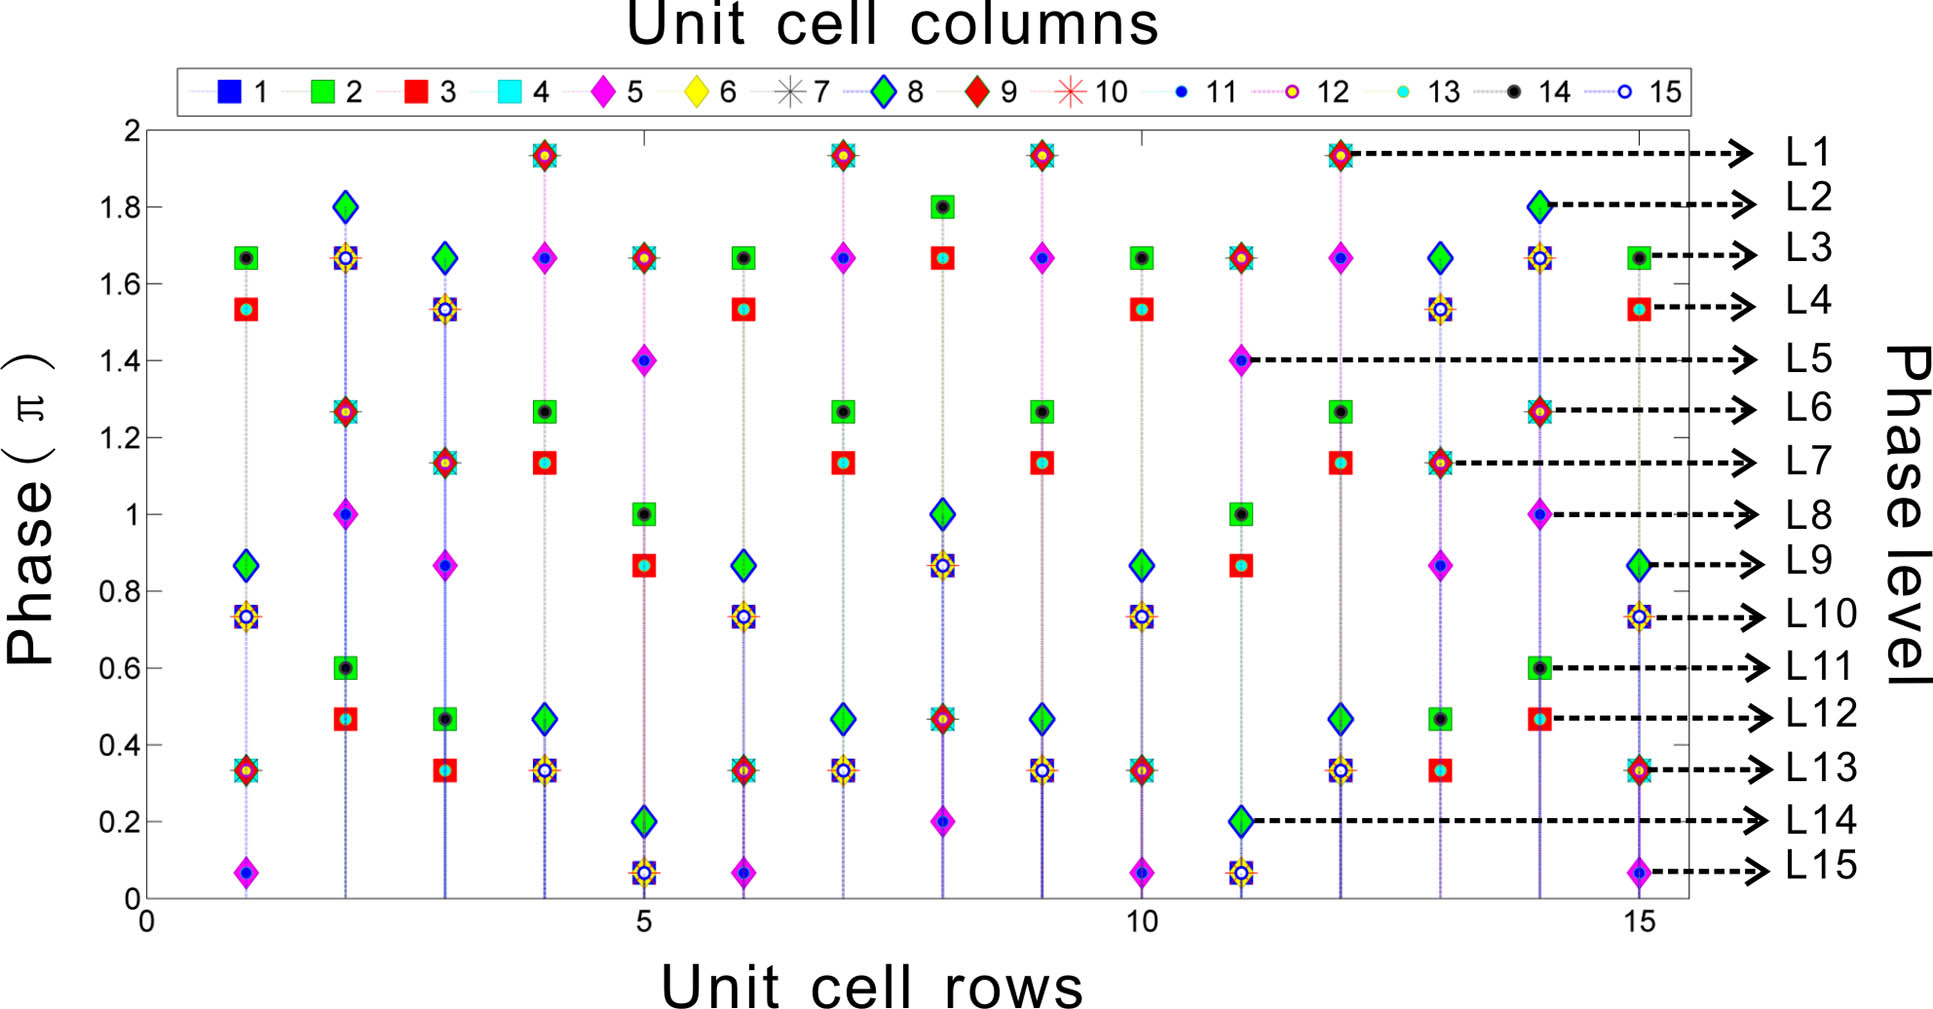
    Fig. 2. Stemplot of the phase levels as shown in Fig. 1(c).
    (a) Structure of the (m, n) cell in the BP-TAI and (b) its phase configuration. The rectangular opening has a width Δ/2 and a height h, and it is shifted from the center of the cell at (mΔ, nΔ) by δmnΔ. (c) Phase distribution within one period of the BP-TAI with β=15. (d) Comparison diagram of the phase distributions along the line through the center of the BP-TAI and the conventional TAI with β=15.
    Fig. 3. (a) Structure of the (m, n) cell in the BP-TAI and (b) its phase configuration. The rectangular opening has a width Δ/2 and a height h, and it is shifted from the center of the cell at (mΔ, nΔ) by δmnΔ. (c) Phase distribution within one period of the BP-TAI with β=15. (d) Comparison diagram of the phase distributions along the line through the center of the BP-TAI and the conventional TAI with β=15.
    (a) Experimental setup for evaluation. (b) Photo of the BP-TAI fabricated using the binary-phase distribution shown in Fig. 3(c). (c) The microscopy image of the BP-TAI. (d) Experimental results of intensity distribution at the corresponding fractional Talbot distance of the BP-TAI.
    Fig. 4. (a) Experimental setup for evaluation. (b) Photo of the BP-TAI fabricated using the binary-phase distribution shown in Fig. 3(c). (c) The microscopy image of the BP-TAI. (d) Experimental results of intensity distribution at the corresponding fractional Talbot distance of the BP-TAI.
    Intensity distribution of the single focal spot field within one period of the BP-TAI: (a) experiment, (b) simulation, (c) ideal image. (d) Comparison of cross-sections through the intensity fields shown in (a) and (b) (note the logarithmic scale).
    Fig. 5. Intensity distribution of the single focal spot field within one period of the BP-TAI: (a) experiment, (b) simulation, (c) ideal image. (d) Comparison of cross-sections through the intensity fields shown in (a) and (b) (note the logarithmic scale).
    Noise effect of the BP-TAI versus the fraction parameter.
    Fig. 6. Noise effect of the BP-TAI versus the fraction parameter.
    Zhigang Li, Rui Yang, Meiyu Sun, Jing Han, Dengying Zhang, Jiannong Chen, Dawei Zhang, Linwei Zhu. Detour phase Talbot array illuminator[J]. Chinese Optics Letters, 2019, 17(7): 070501
    Download Citation