
Shaoxuan WANG, Zhixian LIN, Daochuan GE, Jie WU, Jie YU. Reliability numerical simulation for startup time and startup failure of cold redundancy system in nuclear power plant[J]. NUCLEAR TECHNIQUES, 2022, 45(12): 120604
- NUCLEAR TECHNIQUES
- Vol. 45, Issue 12, 120604 (2022)
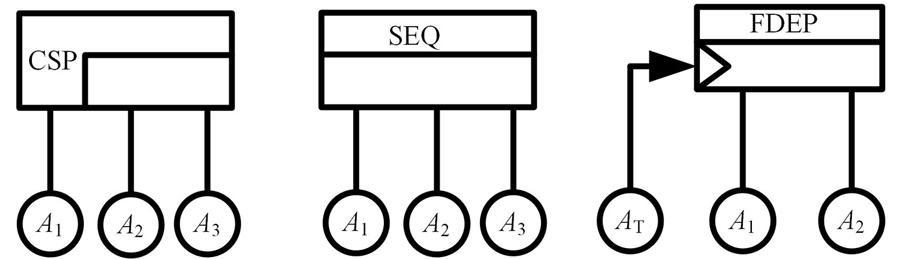
Fig. 1. Dynamic logic gates (a) Cold spare gate, (b) Sequence-enforcing gate, (c) Functional-dependence gate
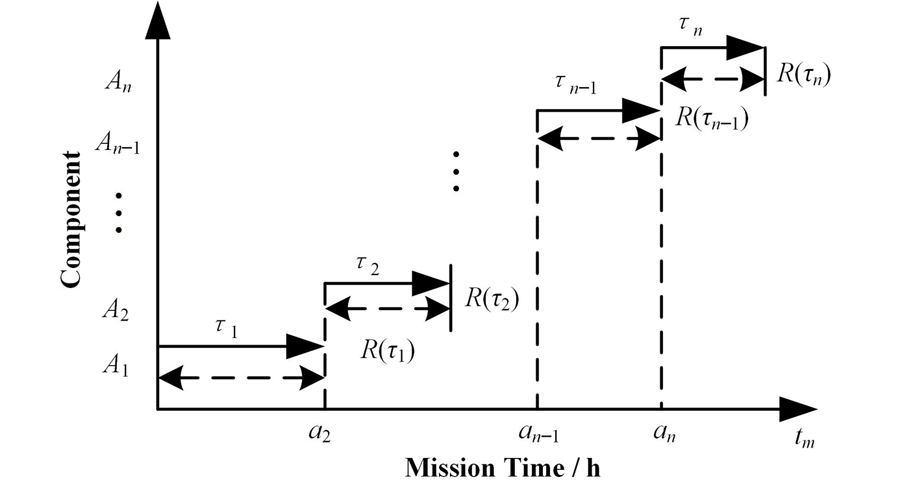
Fig. 2. Sequence failure logic diagram for case:
Fig. 3. Flow chart of Monte Carlo numerical simulation of DFTs based on minimum cut sequence sets
Fig. 4. Sequence failure logic diagram for case:
Fig. 5. Sequence failure logic diagram for case:
Fig. 6. Modeling method of equipment startup time and startup failure in DFT based on Monte Carlo numerical simulation
Fig. 7. System diagram of simplified power supply for nuclear power plant
Fig. 8. DFT model of EDGs[13]
Fig. 9. Comparison of EDGs failure probability (a) Failure probability comparison, (b) Effect of equipment startup time on EDGs failure probability
Fig. 10. The sensitivity change curve of equipment parameters
Fig. 11. Frequency histogram of EDGs failure probability
Fig. 12. Effect of startup characteristics on EDGs failure probability (a) Probability under different start time, (b) ln(
θ) under different start time
|
Table 1. Failure information of EDGs
| ||||||||||||||||||||||||||||||||||||||||||||||||||||||||||
Table 2. Sensitivity index of EDGs equipment parameters
|
Table 3. Distribution parameters of startup-time
|
Table 4. Results of parameters evaluations
|
Table 5. Startup constants of equipment


Set citation alerts for the article
Please enter your email address

© Copyright 2018-2021 | Chinese Laser Press. All Rights Reserved 沪ICP备15018463号-20