• Advanced Photonics
  • Vol. 1, Issue 4, 046004 (2019)
Liangwei Zeng1、2 and Jianhua Zeng1、2、*
Author Affiliations
  • 1Chinese Academy of Sciences, Xi’an Institute of Optics and Precision Mechanics, State Key Laboratory of Transient Optics and Photonics, Xi’an, China
  • 2University of Chinese Academy of Sciences, Beijing, China
  • show less
    DOI: 10.1117/1.AP.1.4.046004 Cite this Article Set citation alerts
    Liangwei Zeng, Jianhua Zeng. Gap-type dark localized modes in a Bose–Einstein condensate with optical lattices[J]. Advanced Photonics, 2019, 1(4): 046004 Copy Citation Text show less
    (a) Number of atoms (N) and (b) maximal real part of eigenvalues versus chemical potential μ for 1-D matter–wave dark gap solitons found in the model with a 1-D periodic optical potential (optical lattice). The gray areas in this and other figures are the bands of linear spectra. Profiles of 1-D dark gap solitons for three marked circles in panel (b): in first BG with (c) μ=1.23 and (d) μ=1.8, and in second BG with (e) μ=3.6. Here and in Fig. 2, we set V0=3, and we set g=1.5 throughout the paper. SIG in panel (a) [and in Figs. 2(a) and 4(a)] denotes the semi-infinite gap. Black dashed line in panel (e) represents the scaled shape of the optical lattice.
    Fig. 1. (a) Number of atoms (N) and (b) maximal real part of eigenvalues versus chemical potential μ for 1-D matter–wave dark gap solitons found in the model with a 1-D periodic optical potential (optical lattice). The gray areas in this and other figures are the bands of linear spectra. Profiles of 1-D dark gap solitons for three marked circles in panel (b): in first BG with (c) μ=1.23 and (d) μ=1.8, and in second BG with (e) μ=3.6. Here and in Fig. 2, we set V0=3, and we set g=1.5 throughout the paper. SIG in panel (a) [and in Figs. 2(a) and 4(a)] denotes the semi-infinite gap. Black dashed line in panel (e) represents the scaled shape of the optical lattice.
    The same as in Fig. 1 but for families of 1-D matter–wave dark gap soliton clusters (composed of seven individuals), with which the nonlinear Bloch waves are accompanied. In the bottom panels (c)–(e), the spacing (Δ) between adjacent solitons is Δ=2π, doubling the period of the optical lattice. The chemical potential μ=1.2 for panel (c); its values for panels (d) and (e) are the same as those in Figs. 1(d) and 1(e), respectively.
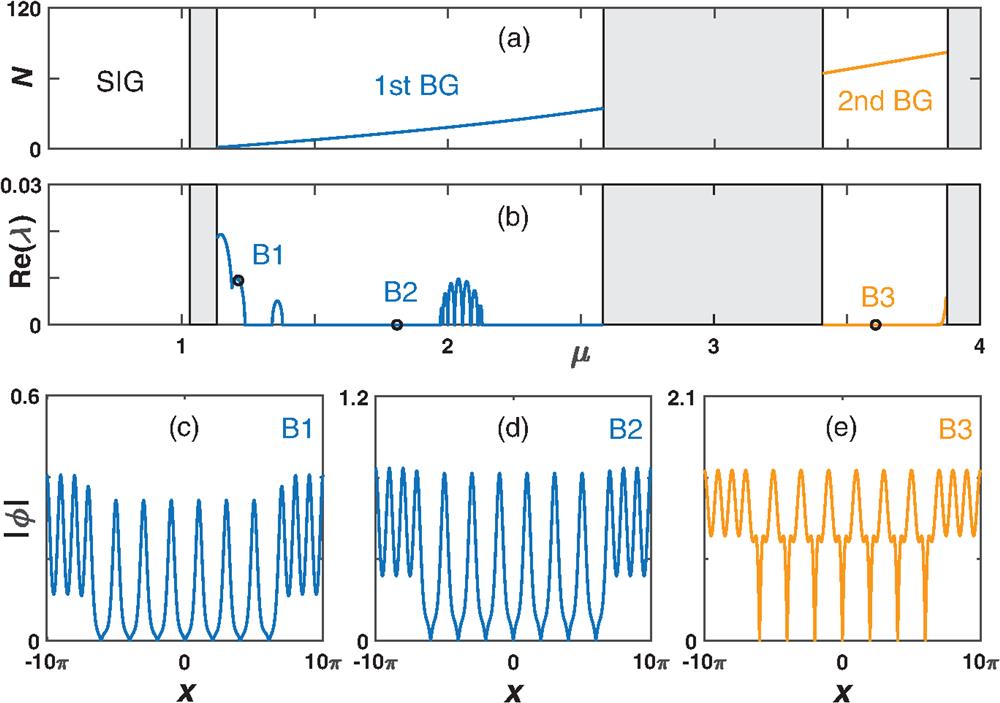
    Fig. 2. The same as in Fig. 1 but for families of 1-D matter–wave dark gap soliton clusters (composed of seven individuals), with which the nonlinear Bloch waves are accompanied. In the bottom panels (c)–(e), the spacing (Δ) between adjacent solitons is Δ=2π, doubling the period of the optical lattice. The chemical potential μ=1.2 for panel (c); its values for panels (d) and (e) are the same as those in Figs. 1(d) and 1(e), respectively.
    Calculated 2-D profiles of the optical periodic potentials (VOL, first row) and their contour plots (central row) as well as the corresponding linear spectra (bottom row): (a) perfect optical lattice, optical lattices with (b) single and (c) multiple bright defects (with the number of defects n=36). Here and below, V0=2.5 and V0=10 are used, respectively, for optical lattices without and with defects. Perpendicular dashed lines in the central two panels represent two coordinates (x and y), with the intersection corresponding to origin of coordinates, point (0, 0).
    Fig. 3. Calculated 2-D profiles of the optical periodic potentials (VOL, first row) and their contour plots (central row) as well as the corresponding linear spectra (bottom row): (a) perfect optical lattice, optical lattices with (b) single and (c) multiple bright defects (with the number of defects n=36). Here and below, V0=2.5 and V0=10 are used, respectively, for optical lattices without and with defects. Perpendicular dashed lines in the central two panels represent two coordinates (x and y), with the intersection corresponding to origin of coordinates, point (0, 0).
    Number of atoms (N) versus chemical potential μ for 2-D matter–wave dark localized modes: (a) dark gap solitons with 1 defect and (b) dark gap soliton clusters supported by the 2-D periodic optical potential (optical lattice) with 36 defects. The three-dimensional density distributions, contour plots, and profiles for the marked realizations C1, C2, and D1 are shown in Figs. 5(a)–5(c), respectively.
    Fig. 4. Number of atoms (N) versus chemical potential μ for 2-D matter–wave dark localized modes: (a) dark gap solitons with 1 defect and (b) dark gap soliton clusters supported by the 2-D periodic optical potential (optical lattice) with 36 defects. The three-dimensional density distributions, contour plots, and profiles for the marked realizations C1, C2, and D1 are shown in Figs. 5(a)5(c), respectively.
    Calculated atom density distributions (first row), their contour plots (central row), and the profiles (bottom row) of 2-D matter–wave dark gap modes: dark solitons in (a) the first BG with μ=3.1 and (b) the second BG with μ=4.36; (c) dark gap wave (soliton clusters) in the first BG with μ=3.1. Dashed lines in the first central panel represent the Cartesian co-ordinate system.
    Fig. 5. Calculated atom density distributions (first row), their contour plots (central row), and the profiles (bottom row) of 2-D matter–wave dark gap modes: dark solitons in (a) the first BG with μ=3.1 and (b) the second BG with μ=4.36; (c) dark gap wave (soliton clusters) in the first BG with μ=3.1. Dashed lines in the first central panel represent the Cartesian co-ordinate system.
    Contour plots of the atom density distribution (top), phases (central), and eigenvalues (bottom) of the 2-D matter–wave dark gap modes with engraved vortex: with vortex charge (a) m=1 at μ=4.36, (b) m=2 at μ=2.4, and (c) m=3 at μ=3.1. Panel (a) represents dark gap vortex; panels (b) and (c) represent stable and unstable vortex states of dark gap soliton clusters, respectively.
    Fig. 6. Contour plots of the atom density distribution (top), phases (central), and eigenvalues (bottom) of the 2-D matter–wave dark gap modes with engraved vortex: with vortex charge (a) m=1 at μ=4.36, (b) m=2 at μ=2.4, and (c) m=3 at μ=3.1. Panel (a) represents dark gap vortex; panels (b) and (c) represent stable and unstable vortex states of dark gap soliton clusters, respectively.
    Liangwei Zeng, Jianhua Zeng. Gap-type dark localized modes in a Bose–Einstein condensate with optical lattices[J]. Advanced Photonics, 2019, 1(4): 046004
    Download Citation