
Yun-Tian Wang, Xiang-Guo Zeng, Xin Yang. Molecular dynamics simulation of effect of temperature on void nucleation and growth of single crystal iron at a high strain rate [J]. Acta Physica Sinica, 2019, 68(24): 246102-1
- Acta Physica Sinica
- Vol. 68, Issue 24, 246102-1 (2019)
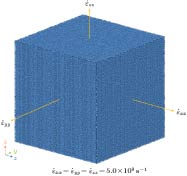
Fig. 1. Model of single crystal iron under triaxial tension (atoms are colored by CNA).单晶铁三轴拉伸模型
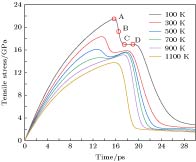
Fig. 2. Tensile stress as a function of time at 100–1100 K.100—1100 K温度下拉应力随时间的变化
Fig. 3. Relationship of peak pressure and temperature.拉应力峰值随温度的变化
Fig. 4. Void volume fraction as a function of time at 100– 1100 K.100—1100 K温度下孔洞体积分数随时间的变化
Fig. 5. Void nucleation time at 100–1100 K.100—1100 K温度下孔洞成核时间
Fig. 6. Distribution of voids at 100–1100 K (void volume fraction is 0.1).100—1100 K温度下内部孔洞分布(孔洞体积分数为0.1时)
Fig. 7. Void volume fraction as a function of time at 100−700 K: (a) 100 K; (b) 300 K; (c) 500 K; (d) 700 K; (e) 900 K; (f) 1100 K.100−1100 K温度下孔洞体积分数与拉应力的关系 (a) 100 K; (b) 300 K; (c) 500 K; (d) 700 K; (e) 900 K; (f) 1100 K
Fig. 8. Void distribution on the second-peak of tensile stress at 100−700 K.100−700 K温度下拉应力时程曲线第二峰值点孔洞分布
Fig. 9. Evolution of dislocation density as a function of time at 100−1100 K: (a) 100 K; (b) 300 K; (c) 500 K; (d) 700 K; (e) 900 K; (f) 1100 K.100−1100 K温度下位错密度变化情况 (a) 100 K; (b) 300 K; (c) 500 K; (d) 700 K; (e) 900 K; (f) 1100 K
Fig. 10. Radial distribution function of the system at 100−1100 K: (a) 100 K; (b) 300 K; (c) 500 K; (d) 700 K; (e) 900 K; (f) 1100 K.100−1100 K温度下径向分布函数变化情况 (a) 100 K; (b) 300 K; (c) 500 K; (d) 700 K; (e) 900 K; (f) 1100 K
Fig. 11. Snapshots for the structural changes at 100−1100 K: (a) 100 K; (b) 300 K; (c) 500 K; (d) 700 K; (e) 900 K; (f) 1100 K.100−1100 K温度下内部结构变化 (a) 100 K; (b) 300 K; (c) 500 K; (d) 700 K; (e) 900 K; (f) 1100 K
Fig. 12. Crystal structure fraction as a function of time at 100−1100 K: (a) 100 K; (b) 300 K; (c) 500 K; (d) 700 K; (e) 900 K; (f) 1100 K.100−1100 K温度下内部晶体结构占比 (a) 100 K; (b) 300 K; (c) 500 K; (d) 700 K; (e) 900 K; (f) 1100 K
Fig. 13. Structural changes at different time at 300 K.300 K温度下系统内部结构变化
Fig. 14. Bond energy of iron at 300−1100 K.300−1100 K温度下铁原子键能
Fig. 15. Potential energy of the system at 100−1100 K.100−1100 K温度下系统势能
Fig. 16. Comparison of void volume fraction between the NAG model and MD at 100−1100 K: (a) 100 K; (b) 300 K; (c) 500 K; (d) 700 K; (e) 900 K; (f) 1100 K.100−1100 K温度下NAG与MD的孔洞体积分数结果的对比 (a) 100 K; (b) 300 K; (c) 500 K; (d) 700 K; (e) 900 K; (f) 1100 K
| |||||||||||||||||||||||||||||
Table 1.
Four characteristic points time at 100– 700 K.
100—700 K温度下四个特征点时间
|
Table 2.
Best-fit NAG parameters at 100−1100 K.
100−1100 K温度下NAG模型最佳拟合参数

Set citation alerts for the article
Please enter your email address
© Copyright 2018-2021 | Chinese Laser Press. All Rights Reserved 沪ICP备15018463号-20