V. F. Tarasenko, M. I. Lomaev, E. Kh. Baksht, D. V. Beloplotov, A. G. Burachenko, D. A. Sorokin, E. I. Lipatov. Spectral and amplitude-time characteristics of crystals excited by a runaway electron beam[J]. Matter and Radiation at Extremes, 2019, 4(3): 037401
Copy Citation Text
The generation of runaway electrons (REs) is a significant problem in tokamak installations, causing energy loss, and melting and vaporization of the walls of the vacuum chamber. The wide deployment of Cherenkov-type detectors, in addition to other methods, is routinely used to detect high-energy electrons. This paper focuses on the cathodoluminescence and Cherenkov radiation excited in different crystals by REs. The spectral energy density of Cherenkov radiation in CaF2 (fluorite) and diamond at various initial electron energies is calculated, taking into account the ionization losses of electron energy, the dispersion of the refractive index of these substances, and the electron energy distribution of the beam.
I. INTRODUCTION
In tokamak installations, runaway electrons (REs) have a deleterious effect on the processes of creation and maintenance of high-temperature plasma.1 Many studies show that REs not only increase electron energy loss but also cause significant damage to vacuum chamber walls.1–9 Various diagnostic devices are being developed to combat this problem, the most common of which is the Cherenkov detector. In such a detector, Cherenkov radiation (CR), in the visible and UV spectral bands, produced by REs passing through a diamond is measured with a photomultiplier.
CR is emitted by a charged particle when it moves in a dielectric faster than the speed of light in that particular material.10 This phenomenon creates a threshold energy, εthr, for a particle; the higher the refractive index, n, the lower εthr. The intensity of CR increases with increasing kinetic energy of the particle, and the spectral power density increases with decreasing wavelength.
Diamond has a fairly high refractive index n = 2.42 and it is transparent in the UV range up to 223 nm. However, when natural and synthetic diamonds are excited by electron beams with electron energies of 101–102 keV, cathodoluminescence bands in the spectral range of 200–800 nm are observed.11,12 The same bands have been observed under excitation by a subnanosecond electron beam, known as a “supershort avalanche electron beam” (SAEB).13 Importantly, CR was not observed in polymethyl methacrylate excited by SAEB.14 Comparison of CR and cathodoluminescence parameters in diamonds has only ever been examined in one previous study: Ref. 15.
In this paper, we continue the study of CR and cathodoluminescence, excited in both natural and synthetic (IIa-type) diamonds, as well as in CaF2. The spectral energy density of the CR for various initial electron energies is calculated, taking into account the ionization losses of the electron energy, the dispersion of the refractive index of these substances, and the electron energy distribution in the beam. The spectral and amplitude-time characteristics of the radiation were measured.
II. CHERENKOV RADIATION
A. Spectral power density of Cherenkov radiation
The spectral power density of CR dP(λ)/dλ can be expressed as follows:10where . Here, F is the effective radiative deceleration force, V is the electron velocity, n is the refractive index, c is the speed of light in the vacuum, λ is the radiation wavelength, and m is the electron mass. The electron energy threshold, εthr, for the generation of CR in dielectrics is determined by assuming that the bracketed term in (1) is equal to zero. Thus, to generate CR in diamond, the electrons must have energies above εthr ≈ 51 keV. From the bracketed term in (1), it follows that the higher the refractive index, the lower εthr.
In Ref. 15, the behavior of CR using the above expressions was calculated. The dependence of dP(λ)/dλ on n, for example, at λ = 200 nm suggests that increasing n generates a very large increase in the CR spectral energy density for a given electron energy.
Regardless of the type of dielectric, dP(λ)/dλ increases both with decreasing λ and with increasing ε. Such dependencies can be found in Ref. 15 in the diagrams for diamond at electron energies of 100 and 200 keV. Usually, the fundamental absorption edge of a dielectric determines the short-wave limit of radiation. Therefore, it is preferable to use crystals that are transparent in the UV and VUV ranges, which avoids overlapping with cathodoluminescence bands. However, the ionization losses of the electron energy, the dispersion of the refractive index of substances studied, and the energy distribution of electrons in a beam were not taken into account in Ref. 15. In Sec. II B, the spectral energy density of CR for diamond and CaF2 (fluorite) at various initial electron energies is calculated, taking into account the ionization losses of the electron energy and the dispersion of the refractive index of these substances. Although CaF2 has a small refractive index, it is transparent in the VUV spectral range (up to 120 nm). The luminescence intensity of the crystal in the spectral range of 250–350 nm is quite high.
B. Accounting for ionization losses of electron energy moving through matter
The total electron energy loss, which has a certain energy, ε, is equal to the sum of ionization and radiation losses – the ionization losses being particularly significant for low-energy electrons. As electron energy increases, the contribution of ionization loss to total energy loss decreases.
The ratio of the specific radiative losses to the specific ionization losses, K, depends mainly on the electron energy, ε, and the nuclear charge, Z:15where ε is in MeV.
We take into account only the ionization losses; therefore, the calculations are valid for an electron energy of up to ∼1 MeV. This electron energy range includes the energies of runaway electrons generated in tokamaks during discharge current decay, as well as the energies of the high-energy electrons generated during a periodic change of magnetic field in tokamaks (ripple-born electrons1).
The ionization losses:16,17where ne is the electron concentration in the matter, and I is the mean excitation energy of the atoms of the matter.
C. Accounting for the dispersion of the refractive index
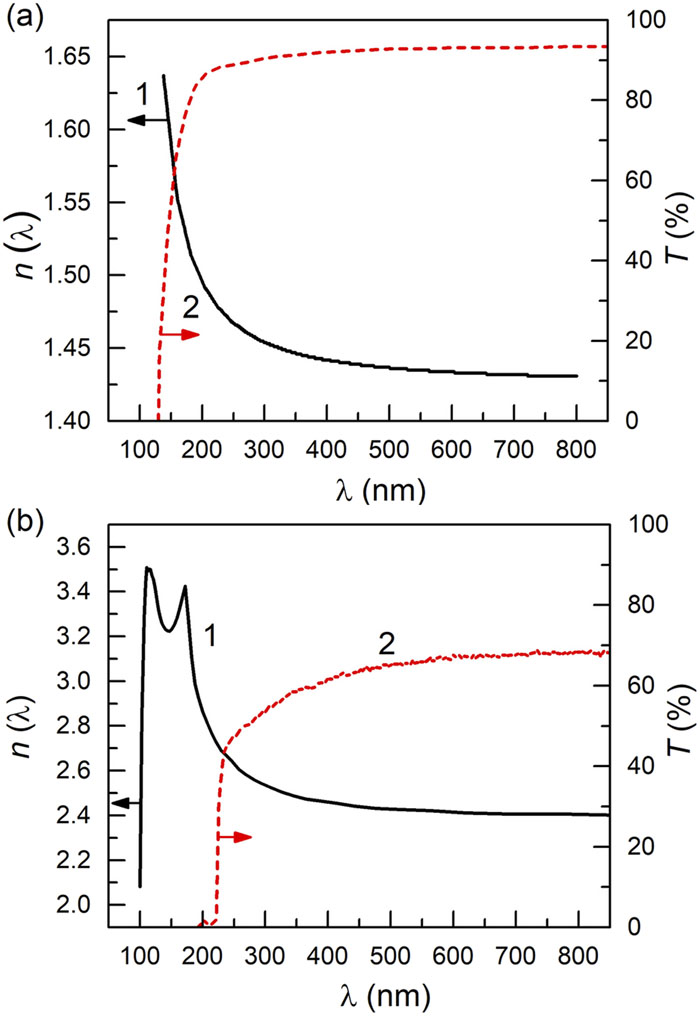
For more accurate calculations of CR spectra in a wide spectral range, it is also necessary to take into account the dependence of the refractive index on the wavelength. The dependence of the refractive index18 and the transmission coefficient19 on the wavelength, λ, for fluorite (a) and diamond (b) are presented in Fig. 1.
Figure 1.Dependence of the refractive index (1) and the transmission coefficient (2) on wavelength λ for fluorite (a) and diamond (b).
As noted above, the electron energy threshold for the generation of CR in various materials has been presented in previous work, for example, in Refs. 20 and 21. The threshold is calculated for a refractive index, nD, which is measured at a wavelength, λD = 589.3 nm (sodium D line).21,22 In most sources, nD is simply denoted as n, meaning n = nD.
The electron energy threshold, taking into account the dispersion of the refractive index, n(λ), is lower than that calculated using nD. The lowest threshold corresponds to the maximum of n(λ). However, the maximum of n(λ) is observed in the region of strong absorption (Fig. 1). As shown by the results, CR is absorbed in this spectral range, and part of the absorbed CR energy promotes photoluminescence.14 Nevertheless, CR can be observed in the transparency region near the absorption edge at an electron energy lower than that calculated using nD. For example, the threshold energy for CR in fluorite calculated using nD is 202 keV, but the value is 134 keV for n (130 nm) [Fig. 1(a)]. The difference is ≈70 keV. For diamond this difference is ≈10 keV. The fundamental absorption edge corresponds to a wavelength of 225 nm [Fig. 1(b)].
The change in electron energy with time can be found by multiplying the electron velocity by (3), and then solving it. The spectral energy density of CR in fluorite and diamond can be found by substituting into (1) the obtained values of the energy of the electrons retarded by the matter and by multiplying (1) by the corresponding time interval. Furthermore, the dispersion of the refractive index should be taken into account [curves 1 in Figs. 1(a) and 1(b)].
The calculated spectra of CR in fluorite and diamond for different electron energies are presented in Fig. 2.
Figure 2.Distribution of the spectral energy density of Cherenkov radiation in (a) fluorite and (b) diamond for different electron energy.
Results show that the shorter the wavelength and the higher the initial electron energy, the higher the spectral energy density of CR.
CR in fluorite is generated at an electron energy below 202 keV (it is the threshold energy calculated using nD[Fig. 2(a)]. For diamond, the result is similar: CR is generated at an electron energy below 51 keV [Fig. 2(b)], which is usually considered the threshold energy.1,20,21 CR generated in the absorption region is partly transformed into luminescence.
III. EXPERIMENTAL SETUP
SAEB was produced by accelerators13,23,24 based on GIN-55-0125 and RADAN-220 generators.26 Block-schemes of experimental setups are presented in Fig. 3.
Figure 3.Block-scheme of experimental setup: 1—transformer oil; 2—insulator; 3—window; 4—13-μm Ti-foil (grounded electrode); 5—capacitive voltage divider; 6—high-voltage tubular electrode; 7—silicone tube; 8—crystal; 9—lens; 10—monochromator; 11—photomultiplier tube; 12—oscilloscope; 13—optical fiber; 14—spectrometer. (a) Registration of amplitude-temporal and spectral characteristics of radiation. (b) Registration of overview spectra of radiation.
The GIN-55-01 generator produces negative voltage pulses with an amplitude of 55 kV, a rise time of 0.7 ns, and a pulse duration of 1 ns, with a matched load. The pulse repetition rate, f, varies from 1 to 100 Hz, with the best results being obtained at f = 65 Hz. The maximum of energy distribution of electrons in the beam corresponded to ∼50 keV (Fig. 4). The percentage of electrons in SAEB with an energy of more than 50 keV (for diamond 51 keV, εthr = 51 keV) was no lower than 60%. The SAEB current pulse duration, τb, was ∼100 ps, and the SAEB current density jb ∼ 1.6 A/cm2.
Figure 4.Runaway electron energy distribution for RADAN-220 and GIN-55-01 generators.
The RADAN-220 generator produces negative voltage pulses with an amplitude of 110 kV, a rise time of 0.5 ns, and a pulse duration of 2 ns, with a matched load. In the experiments, the pulse repetition rate was 1 Hz. By changing the kind of gas and its pressure in the diode, two modes of SAEB generation were implemented.27 Mode #1: jb ≈ 75 A/cm2, τb ≈ 180 ps; mode #2: jb ≈ 1 A/cm2, τb ≈ 100 ps.
The percentage of electrons in SAEB with an energy of more than 50 keV was greater than 95% in both modes. Figure 4 shows the electron energy distribution, and two maxima can be seen at ≈68 and ≈142 keV with the RADAN-220 generator. The proportion of electrons with energy greater than 200 keV did not exceed 1%.
SAEB parameters were measured using a 20-mm collector.13,23,24 The signals from a capacitive voltage divider and a collector were recorded on a Keysight Tech DSO-X 6004A digital oscilloscope (6 GHz, 20 GS/s).
Both the cathodoluminescence and CR spectra were measured. The crystals, in the shape of disks, were irradiated, as shown in Fig. 3. The transmission and emission spectra of the crystals were measured with a HR2000+ES spectrometer (Δλ = 190–1100 nm) of known spectral sensitivity (an instrumental function FWHM ∼ 12 Å). Electromagnetic noise was reduced using a quartz fiber.
The amplitude-time parameters of the emission of crystals were measured using a LOMO MDR-23 monochromator equipped with a Hamamatsu H7732-10 photomultiplier tube (PMT) of known spectral sensitivity (rise time 2.2 ns, Δλ = 185–900 nm). A grating with a groove density of 1200 gr/mm was used. The inverse linear dispersion was 1.3 nm/mm. The width of both entrance and exit slits was 400 μm.
The signals from the capacitive voltage divider and PMT were recorded on a Tektronix TDS3054B digital oscilloscope (500 MHz, 5 GS/s).
IV. EXPERIMENTAL RESULTS
Two samples of diamond and one of fluorite were used in the experiment. Emission spectra of one sample of natural diamond and the fluorite sample are presented in Fig. 5.
Figure 5.Emission spectra for fluorite (1) and natural diamond (2) excited by SAEB on RADAN-220 generator.
Results show that cathodoluminescence bands dominate in the emission spectra of crystals excited by SAEB, with an electron energy of up to 200 keV (Fig. 4). CR was not observed. The experimental results obtained in this paper agree with those already published.15
The amplitude-time parameters of radiation of IIa-type synthetic diamond, grown by chemical vapor deposition, were measured in the setup shown in Fig. 3(a). The intensity of the cathodoluminescence bands of this sample was minimal in comparison with the other crystals. The experimental setup was equipped with the PMT. As a result, CR was registered (Fig. 6).
Figure 6.The registered spectrum (1) and calculated Cherenkov radiation spectrum (2) of IIa-type synthetic diamond.
From Fig. 6 it is seen that for synthetic diamond in the spectral range of 230–350 nm, dQ/dλ increases with decreasing λ. It was found that the proportion of CR in the total radiation of synthetic diamond did not exceed 10%.
The registered spectra were compared with the results of the calculation of CR spectra from (1), taking into account the real energy distribution of electrons in the beam represented in Fig. 4. The calculated curve is also shown in Fig. 6. Radiation energy increases with decreasing wavelength in the spectral range of 225–350 nm. Furthermore, good agreement with the calculations is observed in this spectral range. Cathodoluminescence bands are observed in the spectral range of 350–430 nm.
The waveforms of radiation power of the synthetic diamond are shown in Fig. 7.
Figure 7.Waveforms of radiation power of the synthetic diamond excited by the runaway electron beam.
In the spectral range of 225–350 nm, the waveforms of radiation power pulses correspond to the time resolution of the PMT. The first peaks of the pulses have no delay with respect to the onset of runaway electron beam current pulse and can be considered, therefore, CR. The radiation power and the pulse duration in the spectral range of 350–430 nm increase with increasing λ. A similar result was obtained in our paper (Ref. 15) for wavelengths 260, 415, and 478 nm.
V. CONCLUSION
The spectral energy densities of CR in CaF2 (fluorite) and diamond at various initial electron energies is calculated, taking into account the ionization losses of the electron energy, the dispersion of the refractive index of these substances, and the energy distribution of the electron beam. CR is recorded for electron energies below the energy that is usually given as a threshold, an energy calculated for the refractive index, determined for a wavelength of 589.3 nm (line D of the sodium spectrum).
The optical properties of CaF2 and two diamond crystals, both excited by SAEB, were investigated. Measurement data of the spectral and amplitude-time parameters of crystal radiation, with nanosecond resolution, show that the cathodoluminescence bands make a significant contribution to the emission of the crystals when they are excited by an electron beam with energies ∼101–102 keV. This should be taken into account when designing detectors.
We believe that our data will prove useful in the development of detectors of runaway electrons.
References
[1] M. J. Sadowski. Generation and diagnostics of fast electrons within tokamak plasmas. Nukleonika, 56, 85-98(2011).
[20] V. I. Bespalov. Interaction of Ionizing Radiation with Matter(2008).
[21] Z. A. Al’bikov, O. V. Kozlov, A. I. Veretennikov. Detectors of Pulsed Ionizing Radiation(1978).
[22] M. A. Kiekpaev, I. N. Parshina, P. A. Ponomareva, E. A. Stroganova. Organic Chemistry. Part 2. Methods for Isolation, Purification and Identification of Organic Compounds: A Practical Work(2013).
[23] V. F. Tarasenko. Generation of Runaway Electron Beams and X-Rays in High Pressure Gases(2016).
V. F. Tarasenko, M. I. Lomaev, E. Kh. Baksht, D. V. Beloplotov, A. G. Burachenko, D. A. Sorokin, E. I. Lipatov. Spectral and amplitude-time characteristics of crystals excited by a runaway electron beam[J]. Matter and Radiation at Extremes, 2019, 4(3): 037401