• Photonics Research
  • Vol. 9, Issue 3, 272 (2021)
Arnaldo Leal-Junior1、5, Jingjing Guo2、*, Rui Min3, António José Fernandes4, Anselmo Frizera1, and Carlos Marques4
Author Affiliations
  • 1Telecommunications Laboratory (LABTEL), Graduate Program in Electrical Engineering, Federal University of Espírito Santo, Vitória-ES 29075-910, Brazil
  • 2School of Instrumentation and Optoelectronic Engineering, Beihang University, Beijing 100191, China
  • 3Center for Cognition and Neuroergonomics, State Key Laboratory of Cognitive Neuroscience and Learning, Beijing Normal University, Zhuhai 519087, China
  • 4Physics Department & I3N, Universidade de Aveiro, Campus Universitário de Santiago, Aveiro 3810-193, Portugal
  • 5e-mail: leal-junior.arnaldo@ieee.org
  • show less
    DOI: 10.1364/PRJ.410168 Cite this Article Set citation alerts
    Arnaldo Leal-Junior, Jingjing Guo, Rui Min, António José Fernandes, Anselmo Frizera, Carlos Marques. Photonic smart bandage for wound healing assessment[J]. Photonics Research, 2021, 9(3): 272 Copy Citation Text show less
    (a) Schematic representation of the proposed optical fiber-embedded smart bandage. (b) The fiber embedded in gauze fabric and hydrocolloid dressing is shown, and two techniques for simultaneous assessment of pressure and pH are shown (using two embedded fibers and the transmitted spectrum analysis). LS, light source; MMF, multimode fiber; PDMS, dye-doped PDMS fiber; PD, photodetector; SPEC, spectrometer.
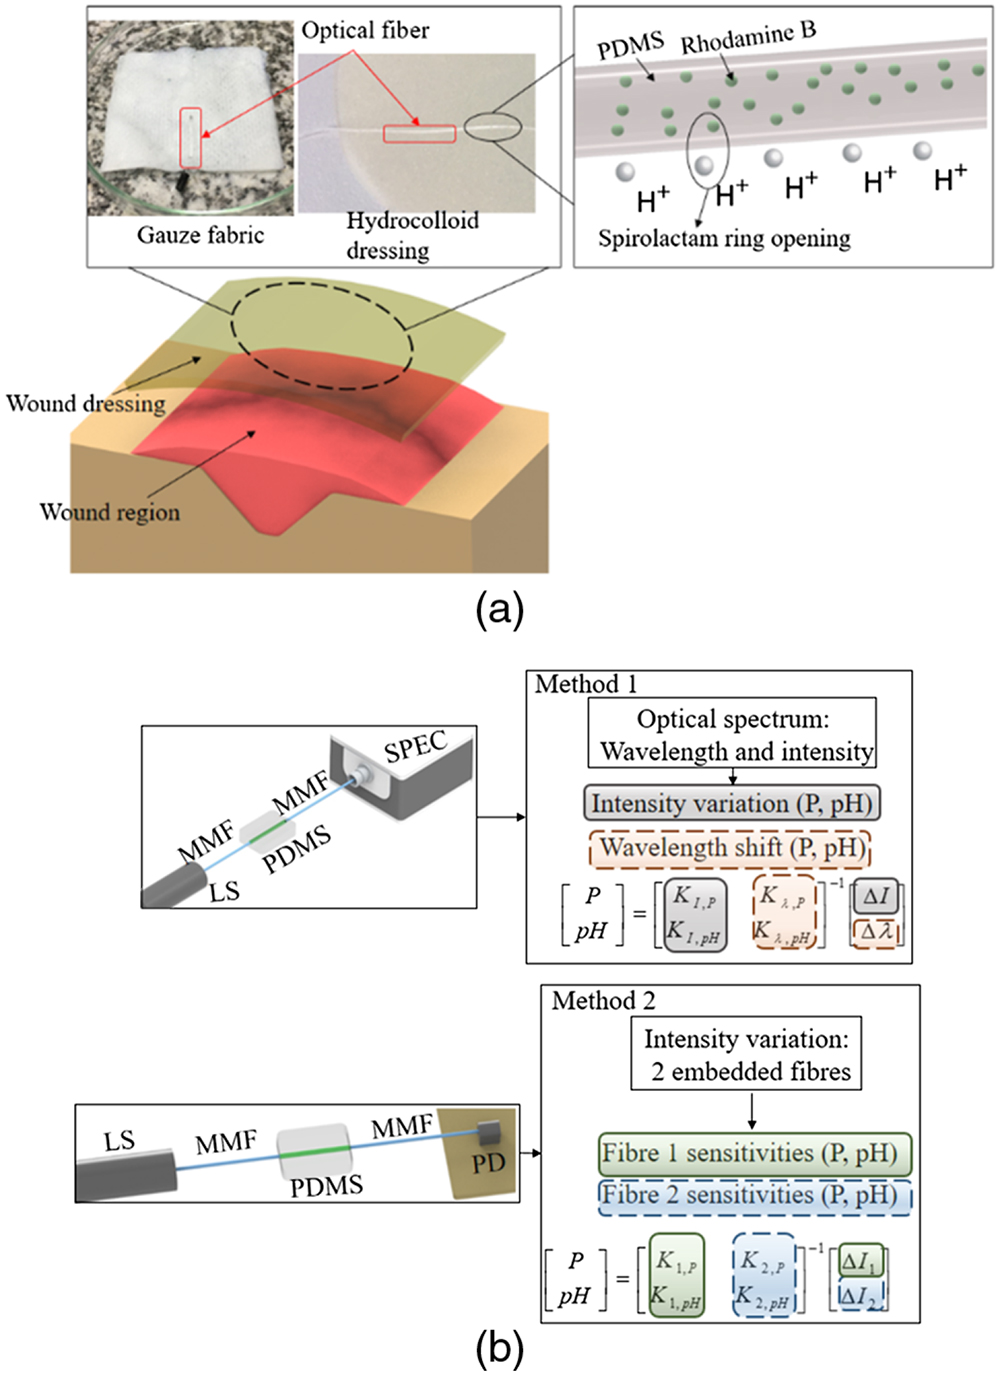
    Fig. 1. (a) Schematic representation of the proposed optical fiber-embedded smart bandage. (b) The fiber embedded in gauze fabric and hydrocolloid dressing is shown, and two techniques for simultaneous assessment of pressure and pH are shown (using two embedded fibers and the transmitted spectrum analysis). LS, light source; MMF, multimode fiber; PDMS, dye-doped PDMS fiber; PD, photodetector; SPEC, spectrometer.
    (a) Raman and (b) infrared spectra of the dye-doped PDMS optical fiber. Figure inset shows the molecular structures of PDMS and rhodamine B.
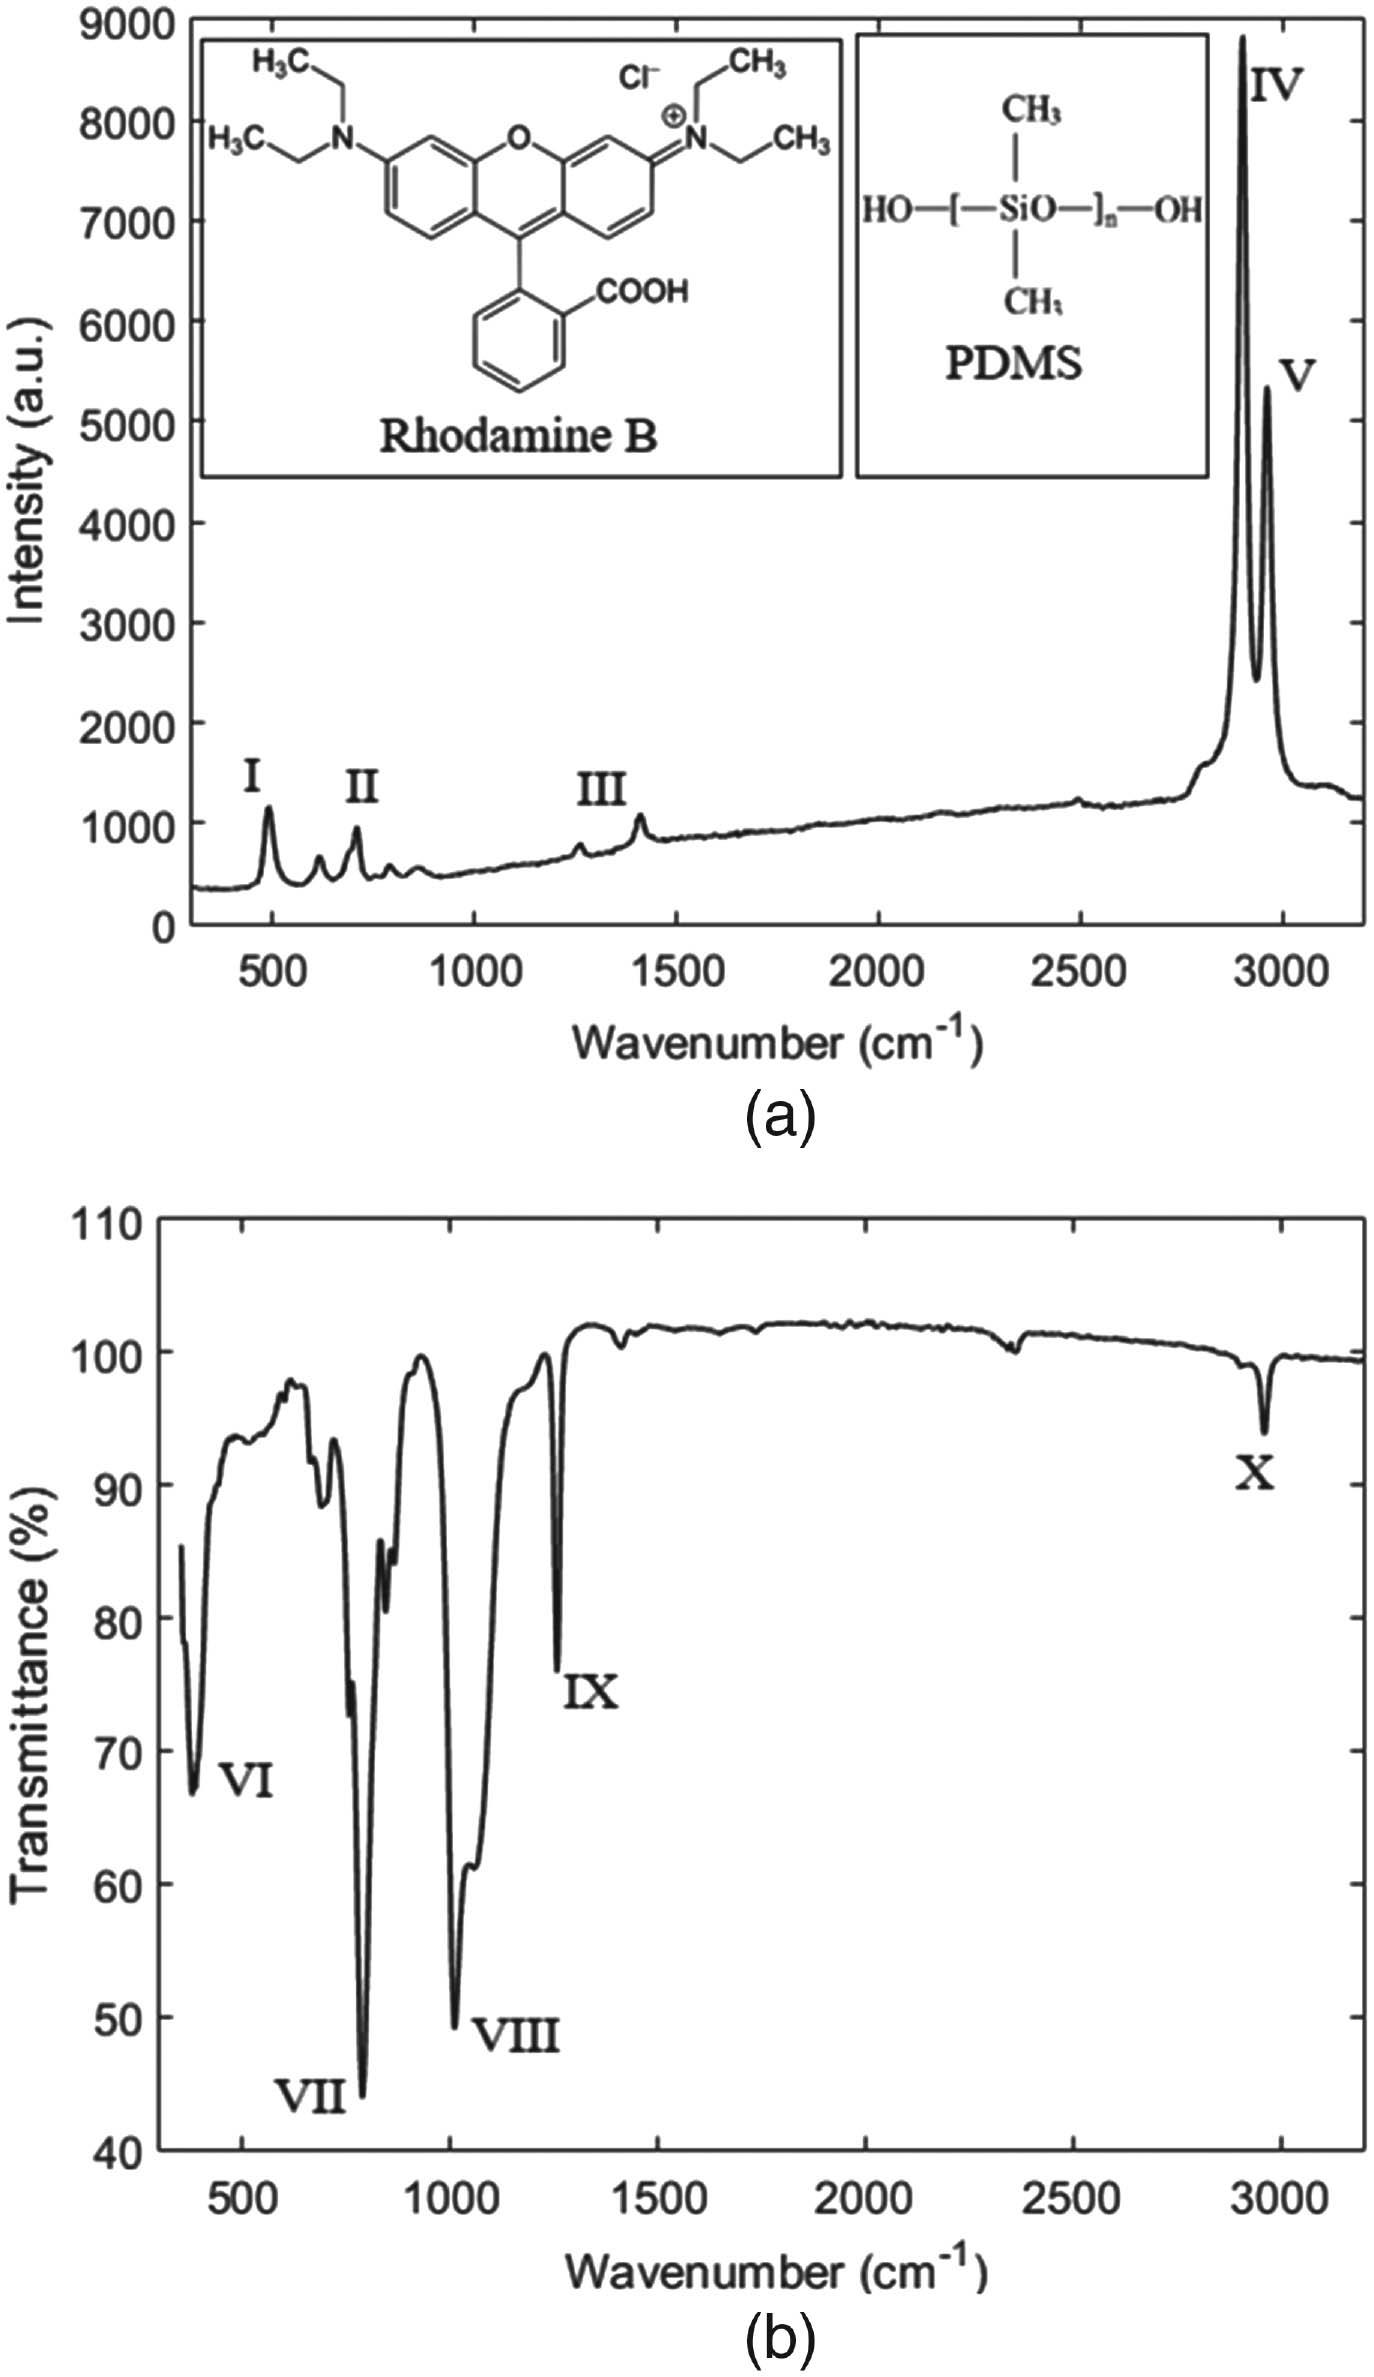
    Fig. 2. (a) Raman and (b) infrared spectra of the dye-doped PDMS optical fiber. Figure inset shows the molecular structures of PDMS and rhodamine B.
    Experimental stress-strain curves of the hydrocolloid dressing, gauze fabric, and dye-doped PDMS fiber.
    Fig. 3. Experimental stress-strain curves of the hydrocolloid dressing, gauze fabric, and dye-doped PDMS fiber.
    (a) Transmitted optical power loss as a function of time for a constant pressure of 0.32 kPa. Shaded region represents the standard deviation in the pressure assessment. (b) Linear regression of the normalized optical loss as a function of the applied pressure.
    Fig. 4. (a) Transmitted optical power loss as a function of time for a constant pressure of 0.32 kPa. Shaded region represents the standard deviation in the pressure assessment. (b) Linear regression of the normalized optical loss as a function of the applied pressure.
    Transmitted optical spectrum of the proposed smart bandage under three pH conditions. Figure insets show the intensity and peak wavelength as a function of the pH.
    Fig. 5. Transmitted optical spectrum of the proposed smart bandage under three pH conditions. Figure insets show the intensity and peak wavelength as a function of the pH.
    (a) Linear regression of normalized optical loss variation as a function of the pH. (b) Sensor response under dynamic variations of pH, where the sensor stability and rise and fall times are presented. (c) Normalized optical loss variation as a function of time for cyclic pH variations from pH 4 to pH 6.
    Fig. 6. (a) Linear regression of normalized optical loss variation as a function of the pH. (b) Sensor response under dynamic variations of pH, where the sensor stability and rise and fall times are presented. (c) Normalized optical loss variation as a function of time for cyclic pH variations from pH 4 to pH 6.
    (a) Transmitted spectra of Sensor 1 under different pressure and pH conditions. (b) Wavelength shift for Sensor 1 and intensity variation for Sensors 1 and 2. The pressure and pH estimation for each method is also presented and compared with the reference value of each parameter.
    Fig. 7. (a) Transmitted spectra of Sensor 1 under different pressure and pH conditions. (b) Wavelength shift for Sensor 1 and intensity variation for Sensors 1 and 2. The pressure and pH estimation for each method is also presented and compared with the reference value of each parameter.
    Arnaldo Leal-Junior, Jingjing Guo, Rui Min, António José Fernandes, Anselmo Frizera, Carlos Marques. Photonic smart bandage for wound healing assessment[J]. Photonics Research, 2021, 9(3): 272
    Download Citation