
Xing-Yu Hou, Chuan-Fei Guo. Sensing mechanisms and applications of flexible pressure sensors [J]. Acta Physica Sinica, 2020, 69(17): 178102-1
- Acta Physica Sinica
- Vol. 69, Issue 17, 178102-1 (2020)
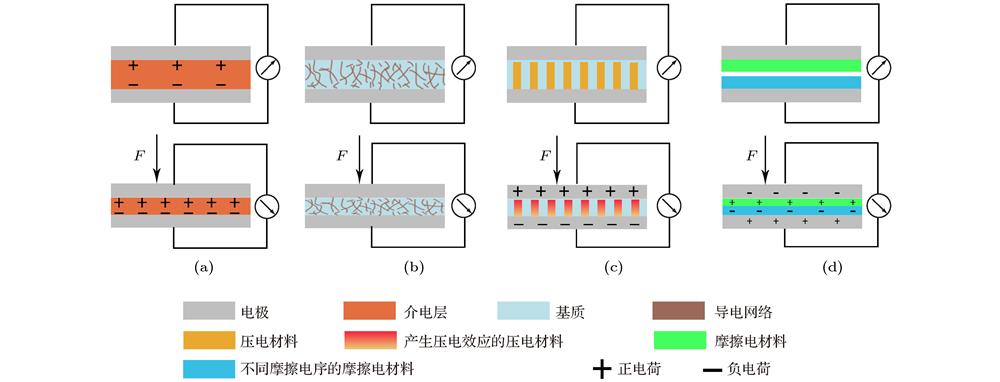
Fig. 1. Different kinds of pressure sensors: (a) Capacitive pressure sensor; (b) resistive pressure sensor; (c) piezoelectric pressure sensor; (d) triboelectric pressure sensor.
![Capacitive pressure sensor and resistive pressure sensor: (a) Graded intrafillable architecture (GIA)-based iontronic pressure sensor with ultra-broad-range high sensitivity[31]; (b) comparison in contact area of electrode and microstructure among hemisphere, tilted pillar, intrafillable pillar without gradient and GIA[31]; (c) resistive pressure sensor with interlocked microdome arrays[43]; (d)the change in resistance among planar, single microdomes and interlocked microdomes[43].](/richHtml/wlxb/2020/69/17/20200987/img_2.jpg)
Fig. 2. Capacitive pressure sensor and resistive pressure sensor: (a) Graded intrafillable architecture (GIA)-based iontronic pressure sensor with ultra-broad-range high sensitivity[31]; (b) comparison in contact area of electrode and microstructure among hemisphere, tilted pillar, intrafillable pillar without gradient and GIA[31]; (c) resistive pressure sensor with interlocked microdome arrays[43]; (d)the change in resistance among planar, single microdomes and interlocked microdomes[43].
Fig. 3. Piezoelectric pressure sensor and triboelectric pressure sensor: (a) Flexible piezoelectric pressure sensor based on polydopamine-modified BaTiO3/PVDF composite film[53]; (b) the output voltages and currents of pressure sensors with different contents of PDA@BTO nanoparticles[53]; (c) a flexible self-powered pressure sensor with coarse PDMS[57]; (d) pressure sensitivity indicating different sensitivities at different pressure regimes[57].
Fig. 4. Response range: (a) Conformable amplified lead zirconate titanate sensors with enhanced piezoelectric response. PDMS film was held by a vacuum tweezer[51]; (b) map of contact pressure. Calculated pressure associated with contact between a PDMS post (1 mm thick) and an array of PZT elements on silicone[51]; (c) graded intrafillable architecture-based iontronic pressure sensor has ultrahigh pressure response range and sensitivity[31].
Fig. 5. Space resolution: (a) Self-powered high-resolution and pressure-sensitive triboelectric sensor matrix based on cross location technique[81]; (b) high-resolution electroluminescent imaging of pressure distribution using a piezoelectric nanowire LED array. A convex character pattern, such as ‘ABC’, is used to apply the pressure pattern on top of the ITO electrode[83]; (c) sensor array tracks to gesture and gives pressure distribution map[81]; (d) electroluminescence images of the device at strains of 0 and –0.15%, respectively[83].
Fig. 6. Pressure sensor with high pressure resolution: (a) Detection of different micro pressure objects placed on three concrete bricks weighing 320 kPa[31]; (b) capacitance signals corresponding to panel[31]; (c) experimental set-up of a car with a GIA-based iontronic pressure sensor bonded under a rear tire, the test frequency is 10 kHz[31]; (d) capacitance signals corresponding to a loaded, unloaded, and reloaded 1.7 kg bag of paper towels in the trunk of the car[31]; (e) capacitance signals corresponding to a 50 kg female passenger getting into and out of the car[31].
Fig. 7. Pressure sensor used for tactile sensing: (a) Schematic and scanning electron microscope image showing the working principle of the Si nanoribbon pressure sensor with a cavity[86]; (b) resistance change when prosthetic limb taps a keyboard and catches a baseball[86]; (c) a chameleon-inspired stretchable electronic skin with interactive color changing controlled by tactile sensing[94]; (d) the change of colors under different pressures[94].
Fig. 8. Health monitoring: (a) Simultaneous fingertip-pulse wave monitoring using the intelligent arteriosclerosis monitoring system based on fingertip-contact pressure sensor and a commercial medical monitor[95]; (b) fingertip-pulse waveforms of a 35-year-old participant (left) and a 65-year-old participant (right) [95]; (c) illustration of TENG -array-based smart textile. Inset is an enlarged view of one TENG unit of the smart textile[98]; (d) graphical user interface of the human body’s posture, position, and pressure distribution (left). Diagrams showing the press number distribution of a sleeper over an entire night (right)[98]; (e) time-sharing histogram of active number during the sleeping period of 23:00 PM to 08:00 AM and the correspondingly generated sleep quality report[98].

Set citation alerts for the article
Please enter your email address
© Copyright 2018-2021 | Chinese Laser Press. All Rights Reserved 沪ICP备15018463号-20