• Photonics Research
  • Vol. 8, Issue 3, 338 (2020)
Danbi Kim, Jiho Park, Taek Jeong, Heonoh Kim, and Han Seb Moon*
Author Affiliations
  • Department of Physics, Pusan National University, Geumjeong-Gu, Busan 46241, South Korea
  • show less
    DOI: 10.1364/PRJ.376993 Cite this Article Set citation alerts
    Danbi Kim, Jiho Park, Taek Jeong, Heonoh Kim, Han Seb Moon. Two-photon interference between continuous-wave coherent photons temporally separated by a day[J]. Photonics Research, 2020, 8(3): 338 Copy Citation Text show less
    (a) Schematic depicting coincidence measurement of two temporally separated CW-mode coherent photons via temporal post-selection. (b) Feynman diagrams depicting indistinguishable events of the TSPT states at the output stage.
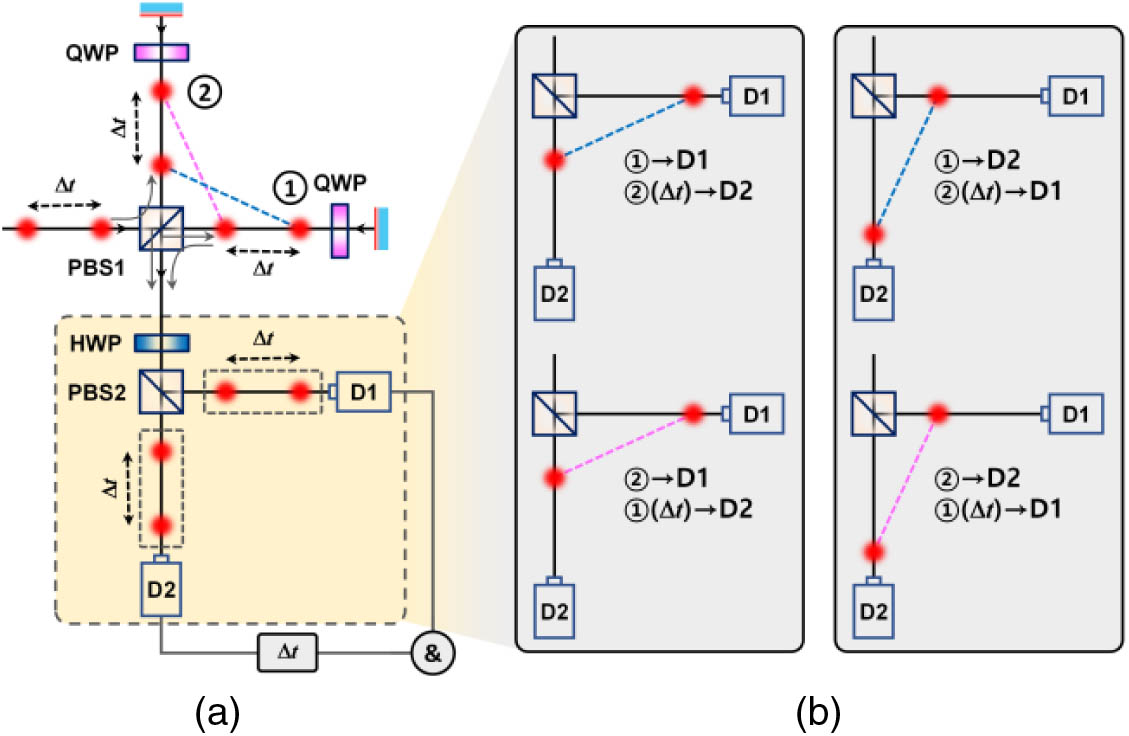
    Fig. 1. (a) Schematic depicting coincidence measurement of two temporally separated CW-mode coherent photons via temporal post-selection. (b) Feynman diagrams depicting indistinguishable events of the TSPT states at the output stage.
    Schematic of experimental setup for HOM interference with a weak CW laser via temporal post-selection with the use of a polarization-based Michelson interferometer (M, mirror; PBS, polarizing beam splitter; IF, interference filter; HWP, half-wave plate; QWP, quarter-wave plate; SPD, single-photon detector).
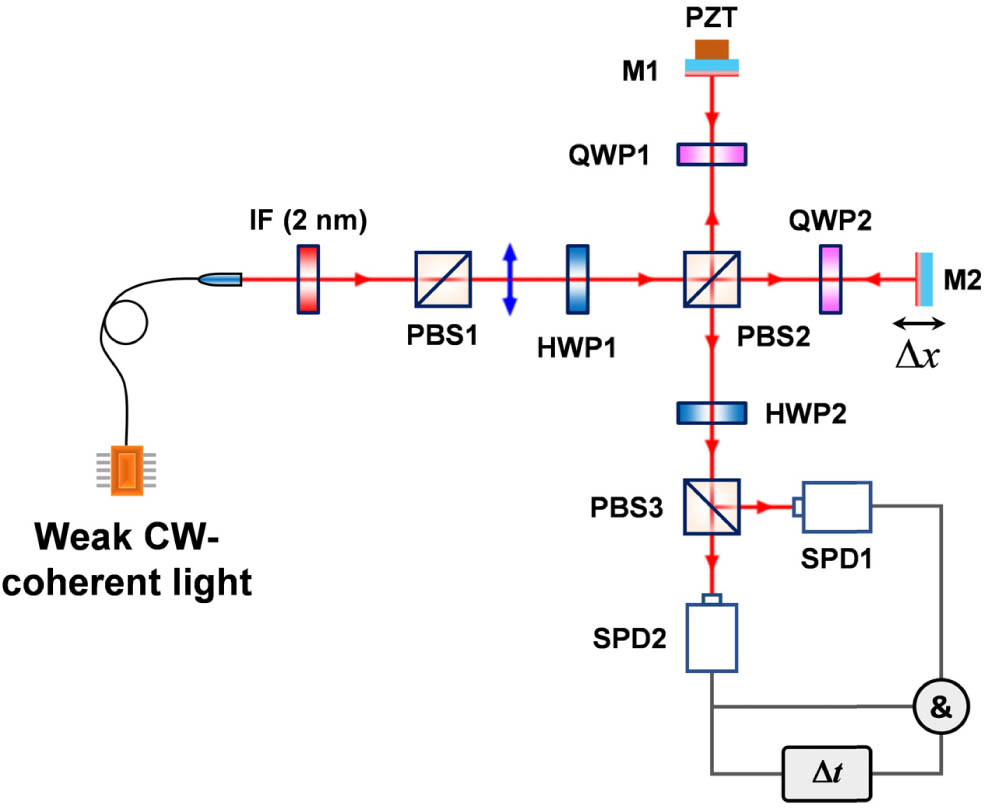
    Fig. 2. Schematic of experimental setup for HOM interference with a weak CW laser via temporal post-selection with the use of a polarization-based Michelson interferometer (M, mirror; PBS, polarizing beam splitter; IF, interference filter; HWP, half-wave plate; QWP, quarter-wave plate; SPD, single-photon detector).
    (a) Schematic for time-delayed coincidence measurement between D1 and D2 at both output ports of the PBS. (b) Normalized coincidence in different spatial modes in the three cases of Δt=0, 40, and 254 ns.
    Fig. 3. (a) Schematic for time-delayed coincidence measurement between D1 and D2 at both output ports of the PBS. (b) Normalized coincidence in different spatial modes in the three cases of Δt=0, 40, and 254 ns.
    (a) Schematic for time-delayed coincidence measurement of two photons in identical spatial modes upon performing two consecutive measurements with one SPD (D2). (b) Normalized coincidence in the same spatial modes in the case of Δt=60 ns.
    Fig. 4. (a) Schematic for time-delayed coincidence measurement of two photons in identical spatial modes upon performing two consecutive measurements with one SPD (D2). (b) Normalized coincidence in the same spatial modes in the case of Δt=60  ns.
    Analysis method for HOM fringe using photons temporally separated by the order of a day: one set (set A) of time-tagged data and another set (set B) are independently obtained after a long time delay ΔT, where D1 and D2 represent the time data of the detection events at D1 and D2, respectively, corresponding to the two spatial modes of the interferometer arms.
    Fig. 5. Analysis method for HOM fringe using photons temporally separated by the order of a day: one set (set A) of time-tagged data and another set (set B) are independently obtained after a long time delay ΔT, where D1 and D2 represent the time data of the detection events at D1 and D2, respectively, corresponding to the two spatial modes of the interferometer arms.
    HOM interference fringe of the TSPT state for ΔT=1 day. (a) HOM dip fringe (orange circles) of one-day-delayed coincidence counts between D1 data of set A and D2 data of set B; the red curve indicates the fitting of the HOM fringe with visibility of 50%±3%. (b) HOM peak fringe (blue circles) of one-day-delayed coincidence counts between D2 data of set A and D2 data of set B in the same spatial modes; the red curve indicates the fitting of the HOM peak fringe.
    Fig. 6. HOM interference fringe of the TSPT state for ΔT=1 day. (a) HOM dip fringe (orange circles) of one-day-delayed coincidence counts between D1 data of set A and D2 data of set B; the red curve indicates the fitting of the HOM fringe with visibility of 50%±3%. (b) HOM peak fringe (blue circles) of one-day-delayed coincidence counts between D2 data of set A and D2 data of set B in the same spatial modes; the red curve indicates the fitting of the HOM peak fringe.
    Danbi Kim, Jiho Park, Taek Jeong, Heonoh Kim, Han Seb Moon. Two-photon interference between continuous-wave coherent photons temporally separated by a day[J]. Photonics Research, 2020, 8(3): 338
    Download Citation