
Hong ZHUANG, Yinhui ZHANG, Zifen HE, Huizhu CAO. Infrared Detection of Gas Leaks Incorporating Structural Reparametric Transformations[J]. Acta Photonica Sinica, 2024, 53(1): 0130002
- Acta Photonica Sinica
- Vol. 53, Issue 1, 0130002 (2024)
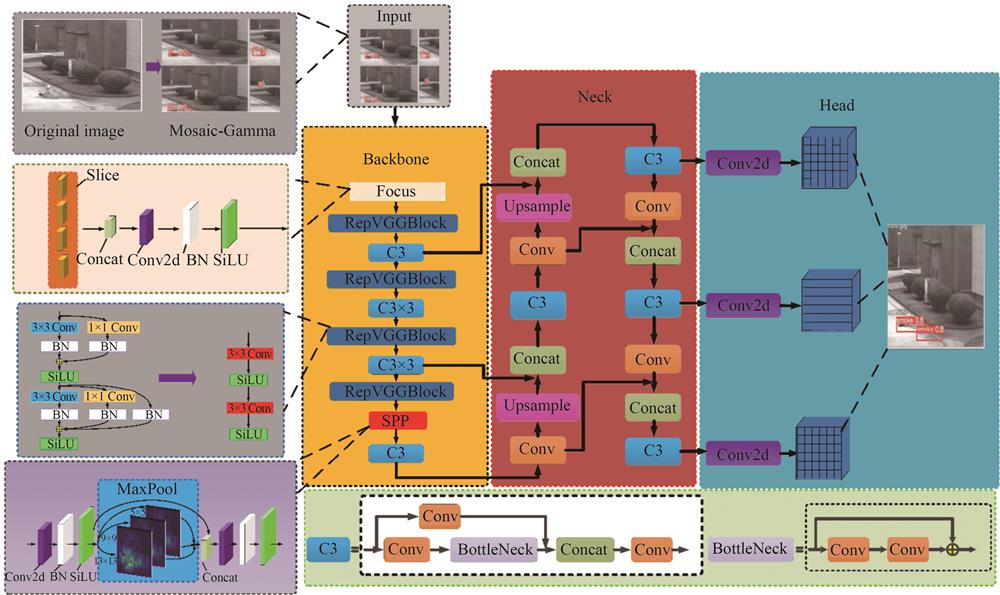
Fig. 1. GRNet model general architecture
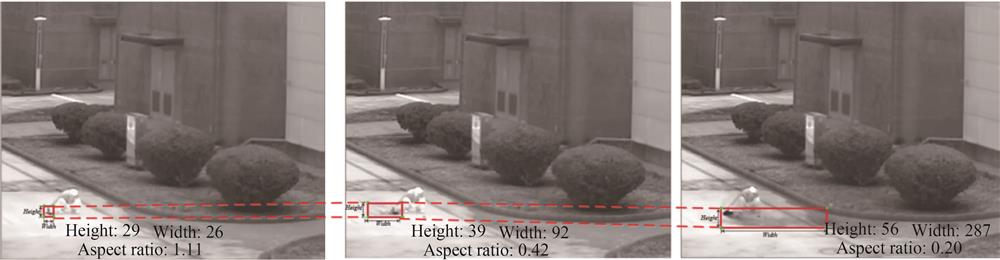
Fig. 2. Change diagram of real frame of infrared the gas leakage
Fig. 3. Visualization of gas leakage candidate box clustering analysis
Fig. 4. Aspect ratio visualization results of candidate frames for gas leak infrared detection dataset
Fig. 5. Mosaic data enhancement
Fig. 6. Gamma transform rendering
Fig. 7. Image enhancement preprocessing schematic
Fig. 8. Fitting diagram of real box and prediction box
Fig. 9. CIoU positioning loss
Fig. 10. Structure of feature extraction network reconstructed by RepVGG module
Fig. 11. RepVGG module structure diagram
Fig. 12. The final test result of the GRNet network model
Fig. 13. Visualisation of ammonia leak concentration distribution
Fig. 14. Visualisation of the overall interface of the infrared gas leak detection system
|
Table 1. The size of the initial anchor frame of the three detection layers before and after clustering
|
Table 2. Hyperparameter configuration
|
Table 3. Comparison of the verification performance of different localization loss functions for leaky targets
|
Table 4. Comparison of the network performance before and after image pre-processing
|
Table 5. Comparison of network performance before and after clustering
|
Table 6. Different modules embedded network performance verification comparison
|
Table 7. Comparison of the validation accuracy among various network models
|
Table 8. Embedded platform deployment test results


Set citation alerts for the article
Please enter your email address

© Copyright 2018-2021 | Chinese Laser Press. All Rights Reserved 沪ICP备15018463号-20