
Yan Wang, Jin-Liang Xu, Wen Li, Huan Liu. Molecular dynamics study on structural characteristics of Lennard-Jones supercritical fluids [J]. Acta Physica Sinica, 2020, 69(7): 070201-1
- Acta Physica Sinica
- Vol. 69, Issue 7, 070201-1 (2020)
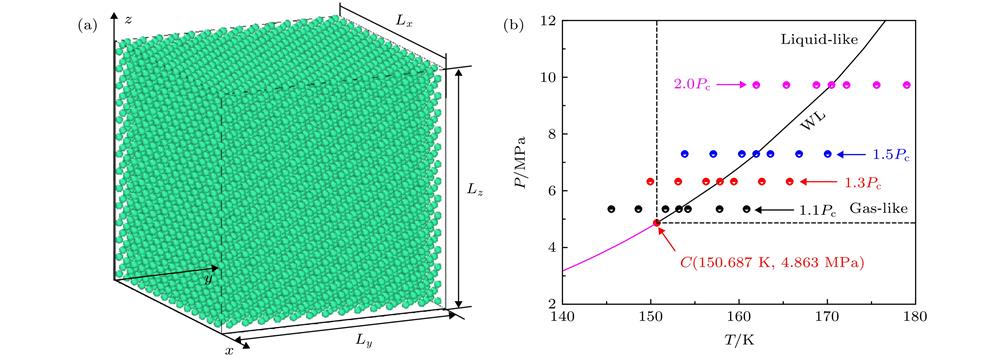
Fig. 1. (a) Physical model of system; (b) simulation points on phase diagram with Widom line, liquid-like and gas-like region.
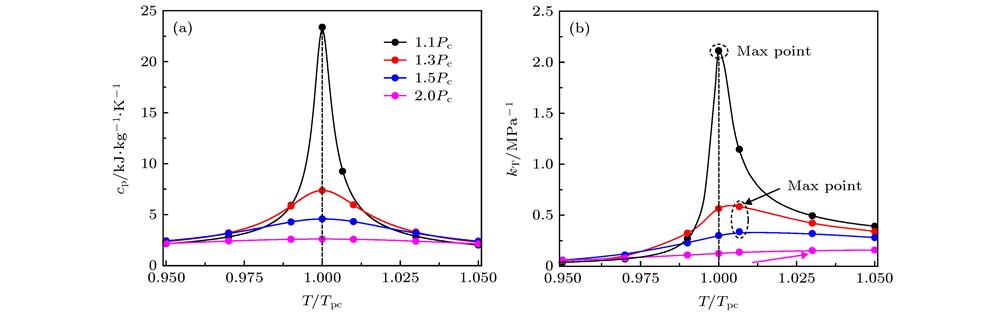
Fig. 2. (a) The curve of c punder different pressures; (b) the curve of k Tunder different pressures.
Fig. 3. Radial distribution function: (a) P = 1.1P c; (b) P = 1.3P c; (c) P = 1.5P c; (d) P = 2.0P c.
Fig. 4. Coordination number: (a) P = 1.1P c; (b) P = 1.3P c; (c) P = 1.5P c; (d) P = 2.0P c.
Fig. 5. The slope of coordination number curve.
Fig. 6. Liqud atoms evolution over the xy plane with different pressure: (a) P = 1.1P c, T = T pc; (b) P = 2.0P c, T = T pc.
Fig. 7. The ratio of high/low density region at pseudo-critical point temperature under different pressure: (a) The ratio of high density region; (b) the ratio of low density region.
Fig. 8. Static structure fator: (a) P = 1.1P c; (b) P = 1.3P c; (c) P = 1.5P c; (d) P = 2.0P c.
Fig. 9. (a) Time series of density for T = T pc; (b) permutation entropy.

Set citation alerts for the article
Please enter your email address
© Copyright 2018-2021 | Chinese Laser Press. All Rights Reserved 沪ICP备15018463号-20