
Ming Shen, Yanxin Li, Qianying Li, Xuewen Shu. Random fiber laser using a cascaded fiber loop mirror[J]. Advanced Photonics Nexus, 2024, 3(3): 036009
- Advanced Photonics Nexus
- Vol. 3, Issue 3, 036009 (2024)
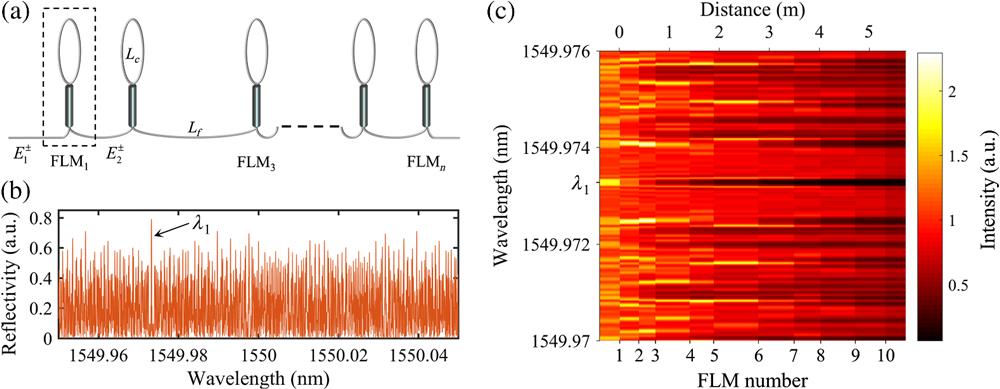
Fig. 1. (a) Schematic of the CFLM. Simulated (b) reflection spectrum and (c) spatial intensity distributions of the 10-CFLM.
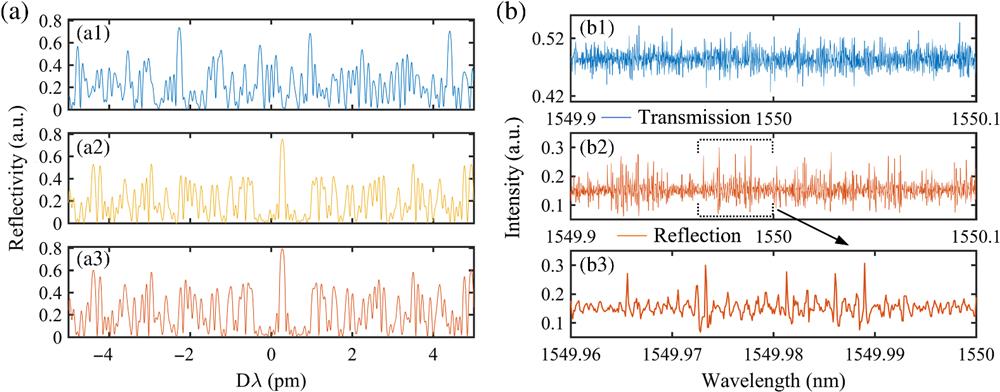
Fig. 2. Simulated reflection spectra of the 10-CFLM at Fig. 1(b) for comparison. Experimentally measured (b1) transmission and (b2) reflection spectra of the 10-CFLM. (b3) Enlargement of panel (b2).
Fig. 3. Experimental setup. LD, laser diode; WDM, wavelength division multiplexer; EDF, erbium-doped fiber; CFLM, cascaded fiber loop mirror; ISO, isolator.
Fig. 4. (a) Output spectra at the pump powers of 22 and 168 mW. Inset is the output spectrum right after the increase of pump power. (b) Output power versus pump power.
Fig. 5. Longitudinal mode envelopes under the pump powers of (a1) 22 mW and (a2) and (a3) 75 mW. (b) Averaged radio-frequency spectra at two different times at the pump power of 168 mW.
Fig. 6. Variation of the Lévy index
Fig. 7. Radio-frequency spectra with (a1) one and (a2) three FLMs. (b) Longitudinal mode envelopes with three FLMs at different times.
Fig. 8. (a) Simulated phase of the electromagnetic field after a round trip as a function of frequency (offset from 193.55 THz). The red points are the solutions of phase conditions. (b) Adjacent longitudinal mode spacing counts from phase conditions. (c) Lasing modes count at different gains. Inset is the enlargement near the

Set citation alerts for the article
Please enter your email address
© Copyright 2018-2021 | Chinese Laser Press. All Rights Reserved 沪ICP备15018463号-20