
Keyang Cheng, Qi Li. Influence of Paper Shelters on Terahertz Double Exposure Digital Holography[J]. Chinese Journal of Lasers, 2021, 48(20): 2014004
- Chinese Journal of Lasers
- Vol. 48, Issue 20, 2014004 (2021)
![Schematic diagrams of double exposure principle. (a) Schematic diagram of double exposure iteration[13]; (b) simulation flowchart of influence of shelters; (c) schematic diagram of Tukey window function](/richHtml/zgjg/2021/48/20/2014004/img_1.jpg)
Fig. 1. Schematic diagrams of double exposure principle. (a) Schematic diagram of double exposure iteration[13]; (b) simulation flowchart of influence of shelters; (c) schematic diagram of Tukey window function
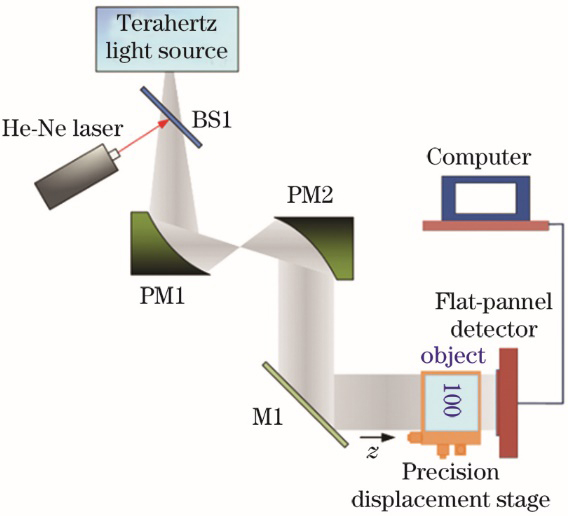
Fig. 2. Schematic diagram of experimental setup
Fig. 3. Actual photos of imaging targets. (a) Lateral resolution is 0.2 mm; (b) lateral resolution is 0.3 mm
Fig. 4. Experimental results of paper parameter measurement. (a) Illumination light image; (b) average hologram of 60 frames of single B5 paper; (b2) reconstructed amplitude image and (b3) histogram of single B5 paper after single exposure APRA and cutting; (c1) average hologram of 60 frames of thermal paper; (c2) reconstructed amplitude image and (c3) histogram of thermal paper after single exposure APRA and cutting
Fig. 5. Experimental results of detector noise measurement. (a) Image of double-layer B5 paper on detector surface; (b) corresponding histogram and Gaussian fitting curve
Fig. 6. Target scenes, holograms, and reconstructed amplitude images of target with lateral resolution of 0.2 mm. (a1)--(a5) No shelter; (b1)--(b5) thermal paper shelter; (c1)--(c5) B5 paper shelter
Fig. 7. Target scenes, holograms, and reconstructed amplitude images of target with lateral resolution of 0.3 mm. (a1)--(a3) No shelter; (b1)--(b3) thermal paper shelter; (c1)--(c3) B5 paper shelter
Fig. 8. Normalized holograms and reconstructed amplitude images of target with lateral resolution of 0.2 mm. (a1)(a2) B5 paper shelter; (b1)(b2) thermal paper shelter; (c1)(c2) no shelter
Fig. 9. Normalized holograms and reconstructed amplitude images of the target with a lateral resolution of 0.3 mm.(a1)(a2) B5 paper shelter; (b1)(b2) thermal paper shelter
Fig. 10. Reconstructed amplitude image of target with lateral resolution of 0.3 mm
|
Table 1. Mean value and contrast ratio calculated from simulation results
|
Table 2. Mean value and contrast ratio calculated from experimental results

Set citation alerts for the article
Please enter your email address
© Copyright 2018-2021 | Chinese Laser Press. All Rights Reserved 沪ICP备15018463号-20