
Manli WANG, Xiaolong WANG, Changsen ZHANG. Infrared and Visible Image Fusion Algorithm Based on Dynamic Range Compression Enhancement and NSST[J]. Acta Photonica Sinica, 2022, 51(9): 0910002
- Acta Photonica Sinica
- Vol. 51, Issue 9, 0910002 (2022)
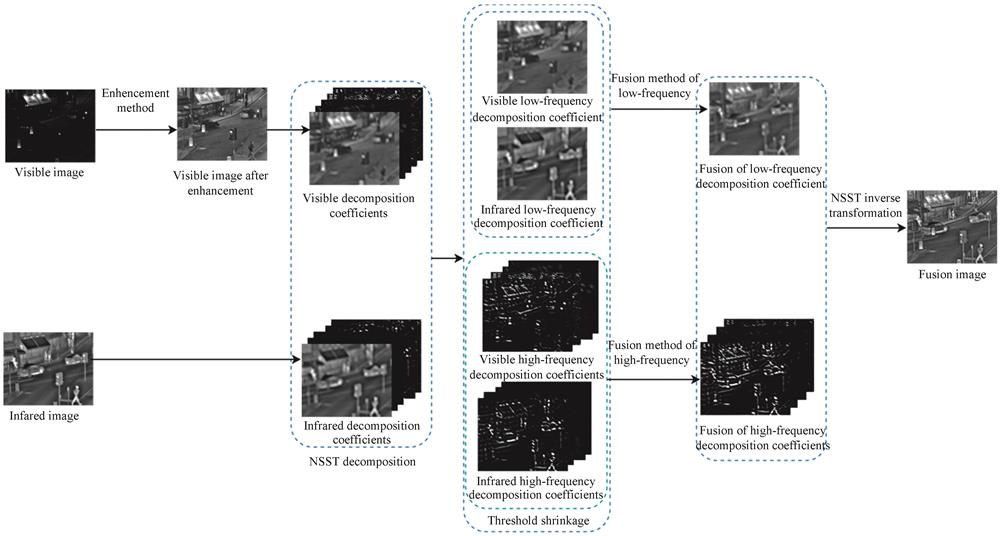
Fig. 1. Infrared and visible image fusion framework
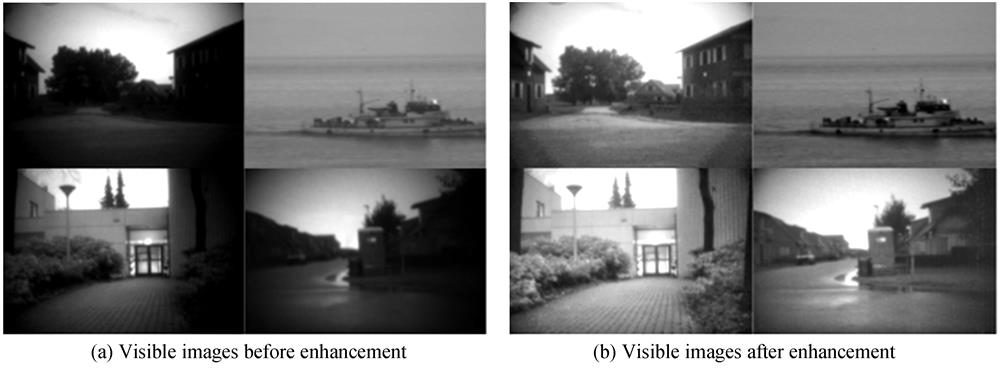
Fig. 2. Comparison of visible images before and after enhancement
Fig. 3. Coefficients extracted by NSST decomposition
Fig. 4. Fusion results of infrared and visible algorithms
Fig. 5. Fusion results of T1~T4 images
Fig. 6. Comparison of objective data of images before and after fusion
Fig. 7. The influence of the selection of threshold shrinkage coefficient on image objective data
Fig. 8. Fusion results of different threshold coefficients
Fig. 9. Fusion results of “Road” images
Fig. 10. Fusion results of “Tent” images
Fig. 11. Fusion results of mine images
Fig. 12. Fusion results of “Road” images with noise variance of 5
Fig. 13. Fusion results of “Road” images with noise variance of 10
|
Table 1. Objective evaluation results of the first two groups of fusion images
|
Table 2. Objective evaluation results of the second two groups of fusion images
|
Table 3. The running time of eight fusion algorithms
|
Table 4. NV statistics of fusion images based on eight algorithms

Set citation alerts for the article
Please enter your email address
© Copyright 2018-2021 | Chinese Laser Press. All Rights Reserved 沪ICP备15018463号-20