• Photonics Research
  • Vol. 11, Issue 8, A19 (2023)
Mohammed Zia Jalaludeen1, Shilong Li1、*, Ke Tian1、2, Toshio Sasaki3, and Síle Nic Chormaic1
Author Affiliations
  • 1Light-Matter Interactions for Quantum Technologies Unit, Okinawa Institute of Science and Technology Graduate University, Onna, Okinawa 904-0495, Japan
  • 2College of Physics and Optoelectronic Engineering, Harbin Engineering University, Harbin 150001, China
  • 3Scientific Imaging Section, Okinawa Institute of Science and Technology Graduate University, Onna, Okinawa 904-0495, Japan
  • show less
    DOI: 10.1364/PRJ.495072 Cite this Article Set citation alerts
    Mohammed Zia Jalaludeen, Shilong Li, Ke Tian, Toshio Sasaki, Síle Nic Chormaic. Structural characterization of thin-walled microbubble cavities[J]. Photonics Research, 2023, 11(8): A19 Copy Citation Text show less

    Abstract

    Whispering gallery mode (WGM) microbubble cavities are a versatile optofluidic sensing platform owing to their hollow core geometry. To increase the light–matter interaction and, thereby, achieve higher sensitivity, thin-walled microbubbles are desirable. However, a lack of knowledge about the precise geometry of hollow microbubbles prevents us from having an accurate theoretical model to describe the WGMs and their response to external stimuli. In this work, we provide a complete characterization of the wall structure of a microbubble and propose a theoretical model for the WGMs in this thin-walled microcavity based on the optical waveguide approach. Structural characterization of the wavelength-scale wall is enabled by focused ion beam milling and scanning electron microscopy imaging. The proposed theoretical model is verified by finite element method simulations. Our approach can readily be extended to other low-dimensional micro-/nanophotonic structures.

    1. INTRODUCTION

    Optical microcavities supporting whispering gallery modes (WGMs) have been investigated intensively in the past two decades [1,2] due to their ultrahigh quality factor (Q-factor), which makes them suitable for various optical applications ranging from cavity quantum electrodynamics [37] to label-free optical detection [812]. Compared with the widely used WGM microcavity geometries such as microspheres [13,14], microtoroids [15], and microrings [16], microbubble cavities or microbubbles [1720] have the advantage of a hollow core and can be used as optofluidic devices in an all-fiber manner [2125]. Moreover, the resultant thin-walled structure of microbubbles provides us with new degrees of freedom, such as the thickness of the wall and its variation along the cavity axis. These allow us to engineer properties related to WGMs such as mode field distribution, mode dispersion, and mode spectrum. Such engineered WGMs are particularly useful for various nonlinear optical processes, for example, four-wave parametric oscillation and frequency comb generation [2629]. Therefore, an accurate determination of the geometry of a microbubble to precisely characterize its WGMs is an important prerequisite for practical applications of such cavities.

    Several methods to determine the thin-walled structure of microbubble cavities in a non-destructive way have already been reported. Bright-field microscopy is probably the simplest approach for measuring the diameter of a microbubble [30], but the low image contrast at a reasonable field of view excludes it as an effective way for a wall thickness measurement. Confocal microscopy has been used to measure the wall thickness of microbubble cavities [31]; however, the image resolution limits the accuracy of the measured thickness to half a wavelength. Obtaining the structural information of the microbubble by inferring its response to a certain stimulus seems to be a non-destructive method for the determination of wall thickness. For example, microbubble wall thickness was measured based on the internal aerostatic pressure sensing method with a measurement uncertainty on the submicron scale [32]. Nonetheless, such a method is not ideal as it requires precise knowledge of the structural information beforehand, and it also assumes a constant wall thickness along the cavity axis. Currently, the only reliable method for studying the wall structure of a microbubble is a destructive approach that involves breaking the microbubble and then measuring its cross-section using, for example, scanning electron microscopy (SEM) [26,33,34]. However, a constant wall thickness along the cavity axis is generally assumed. A fully systematic study on the microbubble wall structure is yet to be carried out.

    In this work, we fully characterize the wall structure of a microbubble cavity using focused ion beam (FIB) milling and SEM imaging. Both the wall thickness and its variation along the cavity axis are obtained, thus enabling us to precisely model the microbubble geometry. Considering the wavelength-scale wall thickness, a theoretical model based on optical waveguide theory is proposed to describe the WGMs in the microbubble cavity. Finite element method simulations are performed to verify the validity of the proposed theoretical model. Our results will benefit not only the development of microbubble cavities but also the exploration of other low-dimensional micro-/nano-photonic structures.

    2. EXPERIMENTAL RESULTS

    Silica microbubbles were fabricated as described previously [33]: a fused silica capillary (360-μm outer diameter and 250-μm inner diameter) was tapered down via a heat-and-pull process using a CO2 laser, resulting in a microcapillary waist. By filling the capillary with compressed gas and increasing the CO2 laser power, microbubbles were produced from the microcapillary. The wall structure of a microbubble (with a thin Au layer coating) at the microcapillary waist was determined by means of FIB milling and SEM imaging (FEI Helios G3 UC); see Fig. 1. Due to the high imaging resolution of both the SEM and FIB, the microbubble’s wall structure was clearly visible. The largest diameter was around 64 μm at the bubble center, where the wall thickness was the smallest (0.85  μm). The bubble diameter gradually decreased, following a Gaussian profile, down to around 28 μm at the support stem, where the wall was thickest at 2.60  μm. With this structural information, the mode structure of the thin-walled microbubble could be fully determined by either theoretical models or numerical simulations, as shown below.

    Structural characterization of a thin-walled microbubble by FIB milling and SEM imaging. (a) The microbubble’s support stem on the left side was initially removed through FIB milling, while half of the support stem on the right side was cut, creating a gap. (b) A third FIB milling was conducted from the center of the left side towards the center of the gap on the right side, resulting in the removal of half of the microbubble. (c) After rotating the microbubble’s left half, the wall structure of the microbubble is clearly visible under SEM imaging. (d) Due to the high SEM imaging resolution, the wall thickness variation along the cavity axis can be determined with accuracy down to the nanometer scale (upper panel). To describe such a wall structure, Gaussian profiles were used to fit the outer and inner boundaries of the microbubble (lower panel). (e) The dependence of the wall thickness t on the outer diameter d of the thin-walled microbubble is shown. A reciprocal linear relation is satisfied near the center of the microbubble at larger outer diameters.

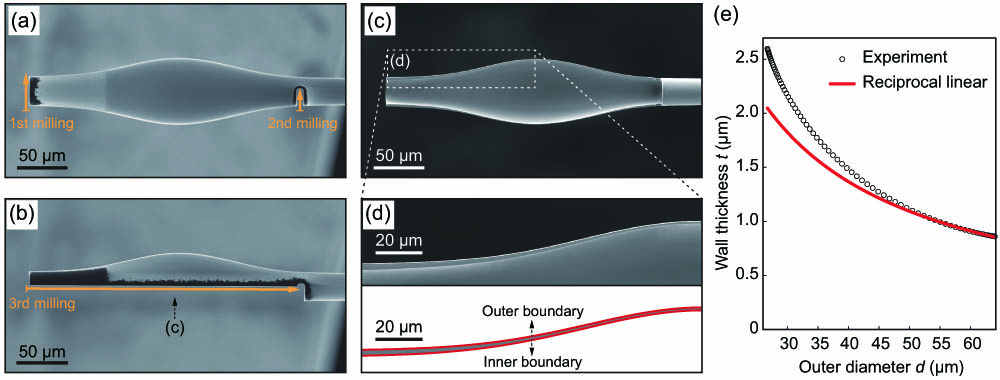
    Figure 1.Structural characterization of a thin-walled microbubble by FIB milling and SEM imaging. (a) The microbubble’s support stem on the left side was initially removed through FIB milling, while half of the support stem on the right side was cut, creating a gap. (b) A third FIB milling was conducted from the center of the left side towards the center of the gap on the right side, resulting in the removal of half of the microbubble. (c) After rotating the microbubble’s left half, the wall structure of the microbubble is clearly visible under SEM imaging. (d) Due to the high SEM imaging resolution, the wall thickness variation along the cavity axis can be determined with accuracy down to the nanometer scale (upper panel). To describe such a wall structure, Gaussian profiles were used to fit the outer and inner boundaries of the microbubble (lower panel). (e) The dependence of the wall thickness t on the outer diameter d of the thin-walled microbubble is shown. A reciprocal linear relation is satisfied near the center of the microbubble at larger outer diameters.

    Wall thickness is a crucial parameter to measure the performance of microbubble-based optical sensors [33]. However, due to the lack of an efficient approach to fully characterize the wall structure, geometrical approaches [30,31,35,36] have widely been used to estimate the wall thickness. These models are based on two assumptions, i.e., constant wall thickness and mass conservation. The first assumption is meaningful when making order-of-magnitude estimates. The second assumption can be split into the following two scenarios: area conservation or volume conservation. In the first case, the microbubble is considered to be the result of cylindrical expansion of a capillary. The cross section of the capillary is a ring with an area of π(d/2)2π(d/2t)2πdt, where d is the bubble’s outer diameter and t its wall thickness (td). The conserved area leads to a reciprocal linear relationship between d and t, i.e., t=c1/d, with coefficient c1. Similarly, for the second case, the microbubble can be viewed as the result of spherical expansion of a spherical bubble with the same diameter as the capillary. Since the volume of the spherical bubble is (4/3)π(d/2)3(4/3)π(d/2t)3πd2t, a reciprocal quadratic relation of t=c2/d2 is obtained with c2 as a coefficient. It is generally believed that the cylindrical expansion gives an over-estimation of wall thickness, therefore the upper limit for the measured thickness, while the lower limit is obtained from spherical expansion [31].

    Figure 1(e) shows the t versus d relationship for the thin-walled microbubble. The wall thickness of the microbubble varies along the bubble axis, clearly showing that it does not have a constant wall thickness, invalidating the first assumption mentioned above. The second assumption is also invalid because the relationship between t and d is neither reciprocal linear nor reciprocal quadratic. Nevertheless, around the center of the thin-walled microbubble (±40  μm from the microbubble center), a reciprocal linear relationship between t and d is satisfied. We attribute these seemingly unusual results to the fact that only the center of the microbubble was melted and fully expanded, while the portions near the support stems experienced lower temperatures and were unable to fully expand. These findings demonstrate the importance of developing an efficient approach for characterizing the wall structure of microbubbles.

    3. THEORETICAL MODEL

    As a type of optical bottle microresonator (BMR), light in microbubbles is trapped in the cross-sectional plane, circulating around the bubble axis, while confined axially, bouncing back and forth between two turning points known as caustics; this is similar to the way charged particles are trapped in magnetic bottles [37]. Such a confinement of light in three dimensions results in the quantization of optical fields into a series of optical modes. With the structural information [Fig. 2(a)] obtained from experimental measurements, the mode structure of the thin-walled microbubble can be theoretically modeled by simplifying Maxwell’s equations.

    Theoretical model of a thin-walled microbubble. (a) Reconstructed 3D geometry of the microbubble from the SEM images shown in Fig. 1. Due to the geometrical symmetries, the electric field distribution of WGMs in the microbubble can be calculated by solving the three coupled differential equations, Eqs. (3)–(5). Three mode indices, i.e., n, m, and l, are resolved in the end to identify the WGMs, in addition to their polarization state (either TM or TE). (b) Radial field distribution. Owing to the wavelength-scale wall thickness, only the fundamental radial mode with n=1 is considered. The inset illustrates the physical meaning of the effective permittivity εeff. (c) Axial field distribution. The quasipotential of the microbubble forms a quantum well—due mainly to diameter variation—that confines the axial motion such that different axial modes emerge. (d) Azimuthal field distribution. Only a small portion of the azimuthal field is shown for better visibility. (e) Dependence of εeff on wall thickness. (f) Illusory example showing a quantum-barrier-like quasipotential (lower panel) formed solely by wall thickness variation (upper panel) where a constant outer diameter was used. (g) Dependence of kcirc on the outer diameter.

    Figure 2.Theoretical model of a thin-walled microbubble. (a) Reconstructed 3D geometry of the microbubble from the SEM images shown in Fig. 1. Due to the geometrical symmetries, the electric field distribution of WGMs in the microbubble can be calculated by solving the three coupled differential equations, Eqs. (3)–(5). Three mode indices, i.e., n, m, and l, are resolved in the end to identify the WGMs, in addition to their polarization state (either TM or TE). (b) Radial field distribution. Owing to the wavelength-scale wall thickness, only the fundamental radial mode with n=1 is considered. The inset illustrates the physical meaning of the effective permittivity εeff. (c) Axial field distribution. The quasipotential of the microbubble forms a quantum well—due mainly to diameter variation—that confines the axial motion such that different axial modes emerge. (d) Azimuthal field distribution. Only a small portion of the azimuthal field is shown for better visibility. (e) Dependence of εeff on wall thickness. (f) Illusory example showing a quantum-barrier-like quasipotential (lower panel) formed solely by wall thickness variation (upper panel) where a constant outer diameter was used. (g) Dependence of kcirc on the outer diameter.

    For azimuthally and axially symmetric microbubbles made of isotropic and homogeneous nonmagnetic dielectric materials, optical spin–orbit coupling is absent [38,39]. Furthermore, most of these microbubbles have a relatively small diameter variation along the axial direction [see Fig. 2(a)]. Therefore, the two sets of polarization modes can be well separated: transverse electric (TE) modes with nonzero axial electric fields and the equivalent transverse magnetic (TM) modes with nonzero axial magnetic fields. Since TE modes preferentially exist in thin-walled microbubbles, only will they be considered in the subsequent analysis. The Helmholtz equation for the nonzero axial electric field Ez of TE modes reads 2Ez(r)+k2εr(r)Ez(r)=0.Here, k=ω/c is the wave vector, ω is the angular frequency, c=1/ε0μ0 is the speed of light, ε0 (μ0) is the permittivity (permeability) in vacuum, and r is the position vector. The relative permittivity εr=ε/ε0, where ε is the permittivity of a material. The relative permeability μr of nonmagnetic materials in the visible and infrared spectral ranges is close to unity, and one may set the material’s permeability μ=μ0.

    The scalar Helmholtz equation for Ez is a three-dimensional (3D) partial differential equation. It can be further simplified by the method of separation of variables in the cylindrical coordinates (ρ,φ,z), defined in Fig. 2(a). To this end, Ez can be expressed in the separable form Ez(ρ,φ,z)=P(ρ)Φ(φ)Ψ(z),where P(ρ), Φ(φ), and Ψ(z) are the radial, azimuthal, and axial field components, respectively. Substituting Eq. (2) into Eq. (1), three ordinary differential equations for the respective field components are obtained: [ρ2d2dρ2+ρddρ+εr,z(ρ)ρ2]P(ρ)=εeff,zP(ρ),d2dφ2Φ(φ)=kcirc,z2εeff,zΦ(φ),(1εeff,zd2dz2+kcirc,z2)Ψ(z)=k2Ψ(z),which are coupled via two coupling constants εeff and kcirc. Here, εeff couples the dynamics of the radial and circular components of light propagation, while kcirc couples the dynamics of the lateral and axial components of light propagation. In the end, the discrete spectrum ω=kc can be obtained by solving these three ordinary differential equations, Eqs. (3)–(5).

    The general solution of Eq. (3) consists of a linear combination of Bessel functions of the first and second kinds. Their coefficients are determined by matching the wall boundary condition [Fig. 2(b)]. The Bessel functions, and therefore P(ρ), look like oscillating sine or cosine functions that decay proportionally to 1/ρ. Different radial modes can be distinguished by the number of “peaks” in the P(ρ), with each mode labeled by a unique radial mode index n=1,2,  . Equation (3) quantifies the effect of wall thickness on these radial modes by using an effective permittivity εeff, i.e., the first coupling constant, which measures the degree of light confinement by the wall [see the inset of Fig. 2(b)]. Since the diameter of microbubbles is typically in the range of a few tens of micrometers, the weakly curved condition is satisfied, and the microbubble wall can be treated as a slab waveguide. Then, εeff can be easily found via the transcendental equation based on the well-established optical waveguide theory [40]: tan(κt)=κγair+κγcoreκ2γairγcore,where γair2=k2εeffk2εair, γcore2=k2εeffk2εcore, κ2=k2εrk2εeff, with εair and εcore the relative permittivities of the surrounding air and the microbubble’s core material, respectively. Figure 2(e) shows the calculated εeff as a function of wall thickness at a few wavelengths of interest. It is clear that the microbubble wall plays a crucial role when its thickness is close to the propagating wavelength. In other words, εeff drops rapidly once the wall thickness is less than the wavelength, as is the case for most microbubble cavities.

    The general solution of Eq. (4) is Φ(φ)=Aexp[±i(βφ+φ0)] with amplitude A and initial phase φ0, where β=kcircεeff can be called the propagation constant. Note that “±” corresponds to the clockwise (CW) and counterclockwise (CCW) modes [9]. To have a stable optical field distribution, the solution must satisfy the periodic boundary condition [Fig. 2(d)] εeff,zπd=mλcirc,z,where λcirc=2π/kcirc is the wavelength in the cross-sectional plane. On the one hand, it leads to WGMs identified by the azimuthal mode index m=0,  1,  2,  . On the other hand, it determines the kcirc in this cross-section, i.e., the second coupling constant. Figure 2(g) shows the dependence of kcirc on the outer diameter. Generally speaking, the smaller the outer diameter, the stronger the azimuthal optical confinement.

    The last equation, Eq. (5), describes the axial dynamics of WGMs. It is a quasi-Schrödinger equation with the quasipotential Veff(z)=cekcirc,z,where the elementary charge e is used to scale the quasipotential in eV. Although not explicitly mentioned in the literature, the quasipotential in most microbubble cavities forms a quantum well, which confines the axial motion of WGMs [Fig. 2(c)]. The quantization of the axial motion in the quantum well results in different axial modes indicated by the axial mode index l=1,  2,  . However, due to the lack of analytical solutions for most quantum well quasipotentials, the finite difference method is widely employed as a reliable numerical approximation technique to solve the quasi-Schrödinger equation. In the finite difference method, this second-order differential equation is discretized into N linear equations: 1εeff,iΨi+12Ψi+Ψi1Δz2+kcirc,i2Ψi=k2Ψifor i=1,  2,  ,  N, where Δz represents the step size. These N linear equations form an N×N matrix equation that can be easily solved using the diagonalization method. The eigenvalues of the matrix equation are the resonance frequencies of the axial modes, while the corresponding eigenvectors are the axial field distributions [40]. It is worth noting that there exist axial potentials that have analytical solutions, such as the harmonic potential [41]; nevertheless, it is a significant challenge to fabricate a microbubble with the desired potential.

    The customizability of their axial modes distinguishes microbottle cavities from microsphere and microtoroid cavities [42]. As one type of microbottle cavity, microbubbles provide a new degree of freedom, i.e., the wall structure, in tailoring axial modes. This becomes clearer with the theoretical model presented here: both wall thickness and its variation contribute to the axial quasipotential in Eq. (8) by determining εeff through Eq. (6) and subsequently influencing the value of kcirc as described in Eq. (7). Figure 2(f) shows an example where a microbubble can provide a quantum barrier for the axial optical motion if the quasipotential is formed solely by the wall structure. This is similar to the axial mode engineering in rolled-up microbottle cavities [40,4346].

    4. SIMULATION VERIFICATION

    The measured 3D structure of the thin-walled microbubble [Fig. 2(a)] allows us to characterize the shape with great accuracy. Therefore, a series of simulations based on the finite element method was carried out, and the results are summarized in Fig. 3. These simulation results were used to verify the validity of the proposed theoretical model.

    Verification of the theoretical model of the thin-walled microbubble by finite element method simulations. (a) Resonant wavelengths for different azimuthal modes. Simulated field distribution in the cross section is shown in the inset. (b) Resonant wavelengths for different axial modes. The inset shows the axial field distribution. n=1 for all cases. Note that the proposed theoretical model can also be used for higher-order radial modes with n>1.

    Figure 3.Verification of the theoretical model of the thin-walled microbubble by finite element method simulations. (a) Resonant wavelengths for different azimuthal modes. Simulated field distribution in the cross section is shown in the inset. (b) Resonant wavelengths for different axial modes. The inset shows the axial field distribution. n=1 for all cases. Note that the proposed theoretical model can also be used for higher-order radial modes with n>1.

    Figure 3(a) shows the resonant wavelengths of WGMs with m ranging from 165 to 175 (l=1 and n=1). The calculated values (λTHE) using the aforementioned theoretical model agree with the simulation results (λSIM) over a wide spectral range. For example, the mean value of the relative deviation |(λTHEλSIM)/λSIM| is only 0.09%. Such good agreement confirms the validity of the proposed theoretical model based on the optical waveguide approximation. This deepens our understanding of the underlying physics and facilitates the design for device applications using thin-walled microbubble cavities.

    The comparison for the axial modes is made in Fig. 3(b) for WGMs with m=170 and n=1. Very good agreement between the theoretical model and simulations is also obtained. This confirms the effectiveness of treating the WGM axial dynamics in the same way as the dynamics of a particle in a quantum well. By doing so, thin-walled microbubble cavities become a reliable experimental platform to test quantum mechanics. On the other hand, quantum theory can be used to engineer axial modes.

    5. DISCUSSION

    First, the most intriguing finding in this work is the feasibility of using the FIB milling approach to explore the internal structure of a microbubble cavity. No special treatment was required for the FIB milling, and there was no observable deformation during or after the milling process. Additionally, there was no noticeable charging effect during the SEM imaging after milling. These observations demonstrate that it is a viable way for characterizing the actual structure of microbubbles, enabling us to go beyond oversimplified approximations such as treating them as uniform spheres.

    Second, the proposed waveguide-based theoretical model for thin-walled microbubble cavities, after verification through simulations, suggests that treating them as 3D ring waveguide resonators is reasonable. This implies that design strategies and methodologies from on-chip photonics could potentially be applied to microbubble cavities. Nonetheless, one must also be aware of the limitations of this waveguide model. For example, when considering liquid-core microbubble cavities, the waveguide approximation may not be applicable to modes with a significant radial field extension.

    Last but not least, the wall structure of a microbubble cavity is explicitly revealed in this work, and wall thickness variation is clearly visible. Therefore, for applications involving various axial modes across a broad spectral range, such as Kerr frequency combs, the thickness variation should be accounted for. However, for certain applications, such as single nanoparticle sensing, a constant thickness approximation for the bubble range of ±20  μm from the center should be acceptable when using low-order axial modes.

    6. CONCLUSION

    We have demonstrated an efficient way to fully characterize the wall structure of a microbubble cavity. The 3D geometry of the microbubble was reconstructed based on FIB milling and SEM imaging. Owing to the wavelength-scale wall thickness, a theoretical model based on the optical waveguide approximation has been proposed to describe the WGMs in the thin-walled microbubble cavity. Simulations have also been performed using the fabricated microbubble structure. Very good agreement between the proposed theoretical model and simulations has been obtained, verifying the validity of the proposed theory. The demonstrated characterization and modeling approaches are readily adaptable for other wavelength-scaled photonic devices.

    Acknowledgment

    Acknowledgment. The authors thank the Engineering Section, the Scientific Computing & Data Analysis Section, and the Scientific Imaging Section of Okinawa Institute of Science and Technology Graduate University (OIST) for technical assistance.

    References

    [1] L. Cai, J. Pan, Y. Zhao, J. Wang, S. Xiao. Whispering gallery mode optical microresonators: structures and sensing applications. Phys. Status Solidi A, 217, 1900825(2020).

    [2] D. Yu, M. Humar, K. Meserve, R. C. Bailey, S. Nic Chormaic, F. Vollmer. Whispering-gallery-mode sensors for biological and physical sensing. Nat. Rev. Methods Primers, 1, 82(2021).

    [3] K. J. Vahala. Optical microcavities. Nature, 424, 839-846(2003).

    [4] S. M. Spillane, T. J. Kippenberg, K. J. Vahala, K. W. Goh, E. Wilcut, H. J. Kimble. Ultrahigh-Q toroidal microresonators for cavity quantum electrodynamics. Phys. Rev. A, 71, 013817(2005).

    [5] T. Aoki, B. Dayan, E. Wilcut, W. P. Bowen, A. S. Parkins, T. J. Kippenberg, K. J. Vahala, H. J. Kimble. Observation of strong coupling between one atom and a monolithic microresonator. Nature, 443, 671-674(2006).

    [6] D. J. Alton, N. P. Stern, T. Aoki, H. Lee, E. Ostby, K. J. Vahala, H. J. Kimble. Strong interactions of single atoms and photons near a dielectric boundary. Nat. Phys., 7, 159-165(2011).

    [7] E. Will, L. Masters, A. Rauschenbeutel, M. Scheucher, J. Volz. Coupling a single trapped atom to a whispering-gallery-mode microresonator. Phys. Rev. Lett., 126, 233602(2021).

    [8] S. Subramanian, H.-Y. Wu, T. Constant, J. Xavier, F. Vollmer. Label-free optical single-molecule micro- and nanosensors. Adv. Mater., 30, 1801246(2018).

    [9] J. Zhu, S. K. Ozdemir, Y.-F. Xiao, L. Li, L. He, D.-R. Chen, L. Yang. On-chip single nanoparticle detection and sizing by mode splitting in an ultrahigh-Q microresonator. Nat. Photonics, 4, 46-49(2010).

    [10] L. Shao, X.-F. Jiang, X.-C. Yu, B.-B. Li, W. R. Clements, F. Vollmer, W. Wang, Y.-F. Xiao, Q. Gong. Detection of single nanoparticles and lentiviruses using microcavity resonance broadening. Adv. Mater., 25, 5616-5620(2013).

    [11] M. D. Baaske, M. R. Foreman, F. Vollmer. Single-molecule nucleic acid interactions monitored on a label-free microcavity biosensor platform. Nat. Nanotechnol., 9, 933-939(2014).

    [12] Y. Kim, H. Lee. On-chip label-free biosensing based on active whispering gallery mode resonators pumped by a light-emitting diode. Opt. Express, 27, 34405-34415(2019).

    [13] J. M. Ward, D. G. O’Shea, B. J. Shortt, S. Nic Chormaic. Optical bistability in Er-Yb codoped phosphate glass microspheres at room temperature. J. Appl. Phys., 102, 023104(2007).

    [14] A. Chiasera, Y. Dumeige, P. Féron, M. Ferrari, Y. Jestin, G. Nunzi Conti, S. Pelli, S. Soria, G. C. Righini. Spherical whispering-gallery-mode microresonators. Laser Photonics Rev., 4, 457-482(2010).

    [15] D. K. Armani, T. J. Kippenberg, S. M. Spillane, K. J. Vahala. Ultra-high-Q toroid microcavity on a chip. Nature, 421, 925-928(2003).

    [16] P. Rabiei, W. H. Steier, C. Zhang, L. R. Dalton. Polymer micro-ring filters and modulators. J. Lightwave Technol., 20, 1968-1975(2002).

    [17] M. Sumetsky, Y. Dulashko, R. S. Windeler. Optical microbubble resonator. Opt. Lett., 35, 898-900(2010).

    [18] A. Watkins, J. Ward, Y. Wu, S. Nic Chormaic. Single-input spherical microbubble resonator. Opt. Lett., 36, 2113-2115(2011).

    [19] M. Asano, H. Yamaguchi, H. Okamoto. Free-access optomechanical liquid probes using a twin-microbottle resonator. Sci. Adv., 8, eabq2502(2022).

    [20] R. Madugani, Y. Yang, V. H. Le, J. M. Ward, S. Nic Chormaic. Linear laser tuning using a pressure-sensitive microbubble resonator. IEEE Photonics Technol. Lett., 28, 1134-1137(2016).

    [21] G. S. Murugan, M. N. Petrovich, Y. Jung, J. S. Wilkinson, M. N. Zervas. Hollow-bottle optical microresonators. Opt. Express, 19, 20773-20784(2011).

    [22] J. M. Ward, Y. Yang, F. Lei, X. C. Yu, Y. F. Xiao, S. Nic Chormaic. Nanoparticle sensing beyond evanescent field interaction with a quasi-droplet microcavity. Optica, 5, 674-677(2018).

    [23] F. Pan, K. Karlsson, A. G. Nixon, L. T. Hogan, J. M. Ward, K. C. Smith, D. J. Masiello, S. Nic Chormaic, R. H. Goldsmith. Active control of plasmonic–photonic interactions in a microbubble cavity. J. Phys. Chem. C, 126, 20470-20479(2022).

    [24] L. T. Hogan, E. H. Horak, J. M. Ward, K. A. Knapper, S. Nic Chormaic, R. H. Goldsmith. Toward real-time monitoring and control of single nanoparticle properties with a microbubble resonator spectrometer. ACS Nano, 13, 12743-12757(2019).

    [25] D. Yang, A. Wang, J.-H. Chen, X.-C. Yu, C. Lan, Y. Ji, Y.-F. Xiao. Real-time monitoring of hydrogel phase transition in an ultrahigh Q microbubble resonator. Photonics Res., 8, 497-502(2020).

    [26] Y. Yang, X. Jiang, S. Kasumie, G. Zhao, L. Xu, J. M. Ward, L. Yang, S. Nic Chormaic. Four-wave mixing parametric oscillation and frequency comb generation at visible wavelengths in a silica microbubble resonator. Opt. Lett., 41, 5266-5269(2016).

    [27] Y. Yang, Y. Ooka, R. M. Thompson, J. M. Ward, S. Nic Chormaic. Degenerate four-wave mixing in a silica hollow bottle-like microresonator. Opt. Lett., 41, 575-578(2016).

    [28] S. Kasumie, Y. Yang, J. M. Ward, S. Nic Chormaic. Towards visible frequency comb generation using a hollow WGM resonator. Rev. Laser Eng., 46, 92-96(2018).

    [29] Y. Yin, Y. Niu, H. Qin, M. Ding. Kerr frequency comb generation in microbottle resonator with tunable zero dispersion wavelength. J. Lightwave Technol., 37, 5571-5575(2019).

    [30] R. Henze, T. Seifert, J. Ward, O. Benson. Tuning whispering gallery modes using internal aerostatic pressure. Opt. Lett., 36, 4536-4538(2011).

    [31] A. Cosci, F. Quercioli, D. Farnesi, S. Berneschi, A. Giannetti, F. Cosi, A. Barucci, G. Nunzi Conti, G. Righini, S. Pelli. Confocal reflectance microscopy for determination of microbubble resonator thickness. Opt. Express, 23, 16693-16701(2015).

    [32] Q. Lu, J. Liao, S. Liu, X. Wu, L. Liu, L. Xu. Precise measurement of micro bubble resonator thickness by internal aerostatic pressure sensing. Opt. Express, 24, 20855-20861(2016).

    [33] Y. Yang, S. Saurabh, J. M. Ward, S. Nic Chormaic. High-Q, ultrathin-walled microbubble resonator for aerostatic pressure sensing. Opt. Express, 24, 294-299(2016).

    [34] F. Lei, J. M. Ward, P. Romagnoli, S. Nic Chormaic. Polarization-controlled cavity input-output relations. Phys. Rev. Lett., 124, 103902(2020).

    [35] J. Yu, J. Zhang, R. Wang, A. Li, M. Zhang, S. Wang, P. Wang, J. M. Ward, S. Nic Chormaic. A tellurite glass optical microbubble resonator. Opt. Express, 28, 32858-32868(2020).

    [36] J. Jiang, Y. Liu, K. Liu, S. Wang, Z. Ma, Y. Zhang, P. Niu, L. Shen, T. Liu. Wall-thickness-controlled microbubble fabrication for WGM-based application. Appl. Opt., 59, 5052-5057(2020).

    [37] M. Sumetsky. Whispering-gallery-bottle microcavities: the three-dimensional etalon. Opt. Lett., 29, 8-10(2004).

    [38] L. Ma, S. Li, V. M. Fomin, M. Hentschel, J. B. Götte, Y. Yin, M. R. Jorgensen, O. G. Schmidt. Spin-orbit coupling of light in asymmetric microcavities. Nat. Commun., 7, 10983(2016).

    [39] J. Wang, S. Valligatla, Y. Yin, L. Schwarz, M. Medina-Sánchez, S. Baunack, C. H. Lee, R. Thomale, S. Li, V. M. Fomin, L. Ma, O. G. Schmidt. Experimental observation of Berry phases in optical Möbius-strip microcavities. Nat. Photonics, 17, 120-125(2023).

    [40] C. Strelow, C. M. Schultz, H. Rehberg, M. Sauer, H. Welsch, A. Stemmann, C. Heyn, D. Heitmann, T. Kipp. Light confinement and mode splitting in rolled-up semiconductor microtube bottle resonators. Phys. Rev. B, 85, 155329(2012).

    [41] X.-C. Yu, S.-J. Tang, W. Liu, Y. Xu, Q. Gong, Y.-L. Chen, Y.-F. Xiao. Single-molecule optofluidic microsensor with interface whispering gallery modes. Proc. Natl. Acad. Sci. USA, 119, e2108678119(2022).

    [42] M. Sumetsky. Optical bottle microresonators. Prog. Quantum Electron., 64, 1-30(2019).

    [43] C. Strelow, H. Rehberg, C. M. Schultz, H. Welsch, C. Heyn, D. Heitmann, T. Kipp. Optical microcavities formed by semiconductor microtubes using a bottlelike geometry. Phys. Rev. Lett., 101, 127403(2008).

    [44] S. Li, L. Ma, S. Böttner, Y. Mei, M. R. Jorgensen, S. Kiravittaya, O. G. Schmidt. Angular position detection of single nanoparticles on rolled-up optical microcavities with lifted degeneracy. Phys. Rev. A, 88, 033833(2013).

    [45] Y. Fang, S. Li, Y. Mei. Modulation of high quality factors in rolled-up microcavities. Phys. Rev. A, 94, 033804(2016).

    [46] Z. Tian, S. Li, S. Kiravittaya, B. Xu, S. Tang, H. Zhen, W. Lu, Y. Mei. Selected and enhanced single whispering-gallery mode emission from a mesostructured nanomembrane microcavity. Nano Lett., 18, 8035-8040(2018).

    Mohammed Zia Jalaludeen, Shilong Li, Ke Tian, Toshio Sasaki, Síle Nic Chormaic. Structural characterization of thin-walled microbubble cavities[J]. Photonics Research, 2023, 11(8): A19
    Download Citation