
Zhengjie QIU, Ke LI, Honglan XIE, Guohao DU, Biao DENG, Tiqiao XIAO. Study of 20 Hz high spatial-temporal resolution monochromatic X-ray dynamic micro-CT[J]. NUCLEAR TECHNIQUES, 2023, 46(7): 070101
- NUCLEAR TECHNIQUES
- Vol. 46, Issue 7, 070101 (2023)
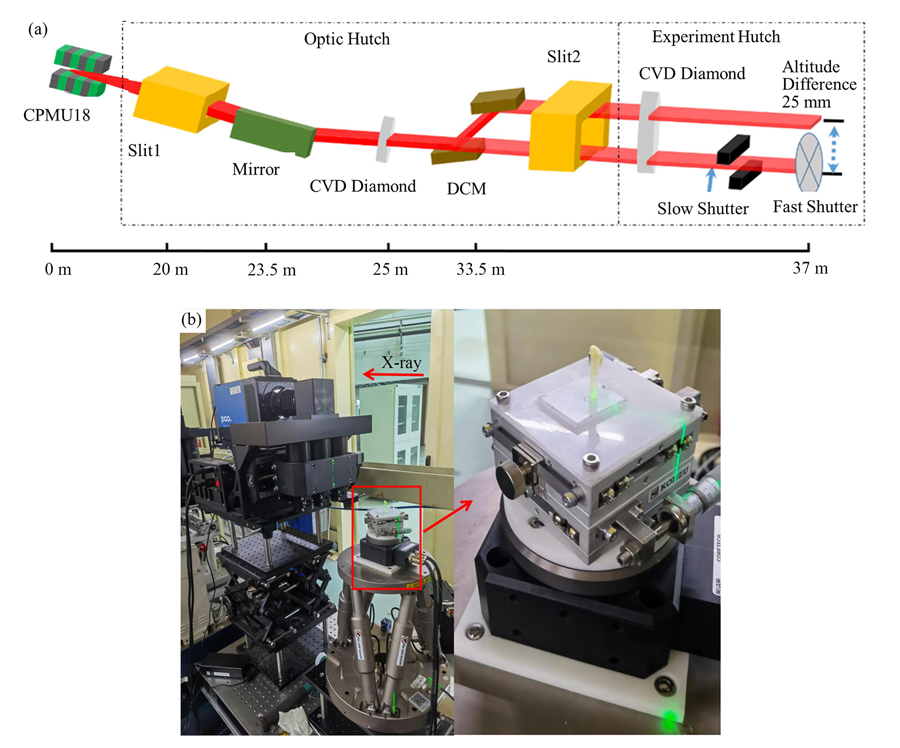
Fig. 1. Experimental setup of BL16U2 beamline(a) Layout of the beamline, (b) Experimental setup for monochromatic X-ray dynamic micro-CT

Fig. 2. Flow chart of the verification experiment
Fig. 3. Reconstruction flow chart
Fig. 4. Test results of spatial resolution of the fast X -ray imaging detector(a) Horizontal and vertical spatial resolutions of the self-developing imaging detection system reached 4 μm when the effective pixel size is 2.2 μm (exposure time 2 ms), (b) Horizontal and vertical spatial resolutions of the current imaging detection systemreached 4 μm when the effective pixel size is 1.625 μm (exposure time 50 ms)
Fig. 5. Comparison of the image quality of the bubble reconstruction slices before and after phase retrieval the slice image and its histogram at the same position before (a, b) and after phase retrieval (c, d)
Fig. 6. Reconstruction slice after phase retrieval (a) and linear analysis (b) at the line segment
Fig. 7. Bubble variation over time at the 400th slice(a) The slice in the initial state, (b~f) The slice at time 0.05 s, 0.1 s, 0.3 s, 0.7 s, and 1.1 s
Fig. 8. Three-dimensional spatial distribution of bubbles at the initial time (a), statistical histogram of bubble diameter (b)
Fig. 9. Three-dimensional motion vector diagram of bubbles obtained by DVC analysis (color online)
Fig. 10. Analyses of the relationship between the average velocity and spatial location, along with the diameter of the bubbles (color online) (a) Radial distribution of the bubbles from the top view, whose average velocities were marked in different colors, (b) Statistical histogram of the average velocity of all bubbles, (c) Relationship between the average velocity and radial location of the bubbles, (d) Relationship between the average velocity and diameter of bubbles
Fig. 11. Analyses of the instantaneous state of bubbles (color online) (a) Chronological variation of central locations of all bubbles, (b, c) Moving routes of a typical large bubble and a small one, (d) Increase in diameters of two bubbles over time, (e) Relationship between instantaneous velocities of two bubbles and time

Set citation alerts for the article
Please enter your email address
© Copyright 2018-2021 | Chinese Laser Press. All Rights Reserved 沪ICP备15018463号-20