• Acta Physica Sinica
  • Vol. 69, Issue 9, 090203-1 (2020)
Wen-Jing Cao1, Xiao-Fei Liu1, Zhuo Han2, Xin Feng2、*, Lin Zhang1、*, Xiao-Fan Liu3, Xiao-Ke Xu4, and Ye Wu5
Author Affiliations
  • 1School of Science, Beijing University of Posts and Telecommunications, Beijing 100876, China
  • 2School of Management Science and Engineering, Hebei GEO University, Shijiazhuang 050031, China
  • 3School of Media and Communication, City University of Hong Kong, Hongkong 999077, China
  • 4School of Information and Telecommunication Engineering, Dalian Minzu University, Dalian 116600, China
  • 5Computational Communication Research Center, Beijing Normal University, Beijing 100875, China
  • show less
    DOI: 10.7498/aps.69.20200503 Cite this Article
    Wen-Jing Cao, Xiao-Fei Liu, Zhuo Han, Xin Feng, Lin Zhang, Xiao-Fan Liu, Xiao-Ke Xu, Ye Wu. Statistical analysis and autoregressive modeling of confirmed coronavirus disease 2019 epidemic cases[J]. Acta Physica Sinica, 2020, 69(9): 090203-1 Copy Citation Text show less
    Number of newly confirmed patients per day of different genders.
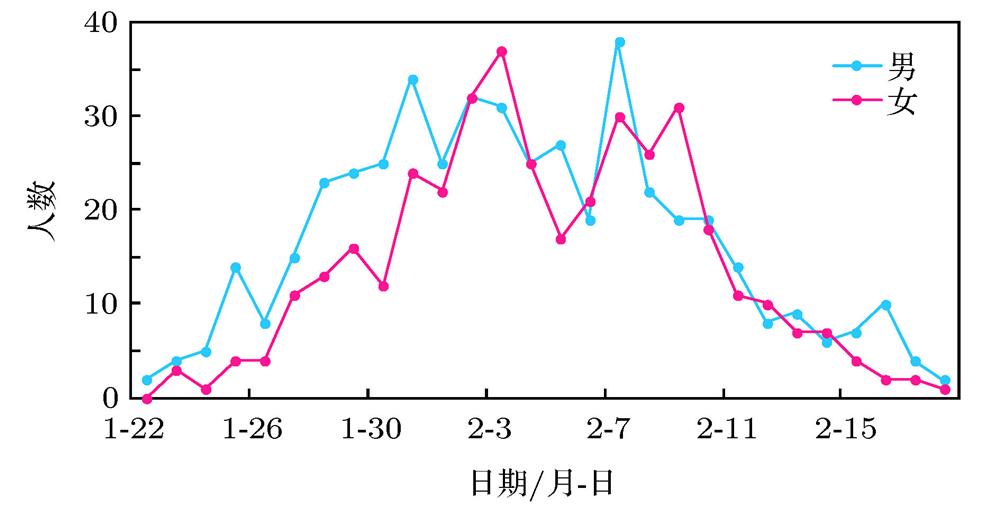
    Fig. 1. Number of newly confirmed patients per day of different genders.
    Proportion of newly confirmed males per day.
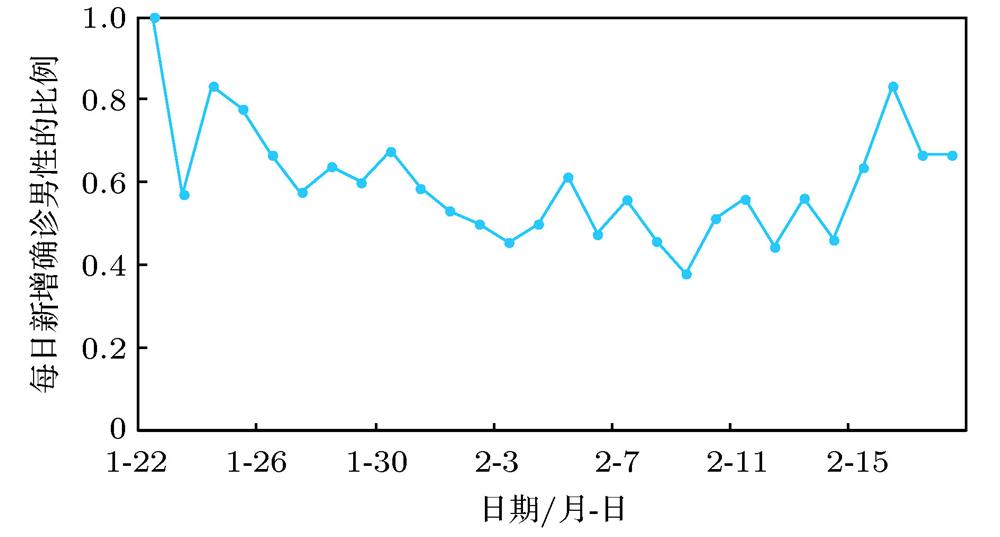
    Fig. 2. Proportion of newly confirmed males per day.
    Number of newly confirmed patients per day from different sources.
    Fig. 3. Number of newly confirmed patients per day from different sources.
    Proportion of newly confirmed imported cases per day
    Fig. 4. Proportion of newly confirmed imported cases per day
    Distribution histogram of the time interval of diagnosis between source infected patients and infected patients. In the figure, the fitting density reference line is the distribution of Γ (10.84, 1.08) and shifts 9 to the left.
    Fig. 5. Distribution histogram of the time interval of diagnosis between source infected patients and infected patients. In the figure, the fitting density reference line is the distribution of Γ (10.84, 1.08) and shifts 9 to the left.
    Number of newly confirmed patients per day and model simulation in Anhui province.
    Fig. 6. Number of newly confirmed patients per day and model simulation in Anhui province.
    Cumulative number of confirmed cases and model simulation in Anhui province.
    Fig. 7. Cumulative number of confirmed cases and model simulation in Anhui province.
    Number of newly confirmed patients per day (except in Hubei province) and model simulation.
    Fig. 8. Number of newly confirmed patients per day (except in Hubei province) and model simulation.
    Cumulative number of confirmed cases (excluding Hubei province) and model simulation.
    Fig. 9. Cumulative number of confirmed cases (excluding Hubei province) and model simulation.
    源传染者-被传染者人数比例
    男-女830.3562
    男-男540.2318
    女-男560.2403
    女-女400.1717
    Table 1.

    Gender statistics of source infected patients and infected patients during virus transmission. The number of valid sample is 233.

    传播过程中源传染患者与被传染患者性别统计(有效样本233例)

    源传染者-被传染者人数比例
    丈夫-妻子360.1538
    妻子-丈夫210.0897
    儿子-母亲110.0470
    母亲-儿子100.0427
    儿子-父亲100.0427
    母亲-女儿70.0299
    父亲-女儿50.0214
    哥哥-弟弟50.0214
    父亲-儿子50.0214
    Table 2.

    Relationship statistics between source infected patients and infected patients during virus transmission. The number of valid sample is 233. Use only statistical sample size greater than or equal to 5. The ratio is the number of people in each category divided by valid sample number 233.

    病毒传播过程中源传染患者与被传染患者关系统计 (有效样本233, 仅截取统计样本量大于等于5的情况, 其中比例为每个类别内的人数除以有效样本数233得到)

    Wen-Jing Cao, Xiao-Fei Liu, Zhuo Han, Xin Feng, Lin Zhang, Xiao-Fan Liu, Xiao-Ke Xu, Ye Wu. Statistical analysis and autoregressive modeling of confirmed coronavirus disease 2019 epidemic cases[J]. Acta Physica Sinica, 2020, 69(9): 090203-1
    Download Citation