Abstract
The recent development of stimulated Raman scattering (SRS) microscopy allows for highly sensitive biological imaging with molecular vibrational contrast, opening up a variety of applications including label-free imaging, metabolic imaging, and super-multiplex imaging. This paper introduces the principle of SRS microscopy and the methods of multicolor SRS imaging and describes an overview of biomedical applications.Raman scattering is an inelastic scattering of light by molecular vibrations, providing us with the vibrational spectrum of molecules. It has been applied to biological imaging to acquire the spatial distribution of biomolecules. However, the applications of Raman imaging have been limited by its long acquisition time ranging from tens of minutes to hours due to the quite weak intensity of Raman scattering. Recently, coherent Raman scattering (CRS) microscopy[1–5] using two-color and/or broadband laser pulses drastically improved the imaging speed and sensitivity of Raman imaging. Among various methods of CRS microscopy, stimulated Raman scattering (SRS) microscopy allows for high-speed and sensitive imaging of biological samples with molecular vibrational contrast[6–8]. Although the original implementation of SRS microscopy was able to detect the SRS signal only at a specific vibrational frequency, various methods of multicolor SRS imaging are available nowadays[9–15], allowing us to detect molecular vibrations at multiple frequencies to identify tiny spectral differences between different biomolecules. Furthermore, combined with recently developed Raman probes, SRS microscopy is finding novel applications such as metabolic imaging[16–18] and super-multiplex imaging[19,20], which have been difficult with previous imaging methods such as fluorescence microscopy.
This paper introduces the principle of SRS microscopy and multicolor SRS imaging methods and reviews the recent applications of SRS microscopy.
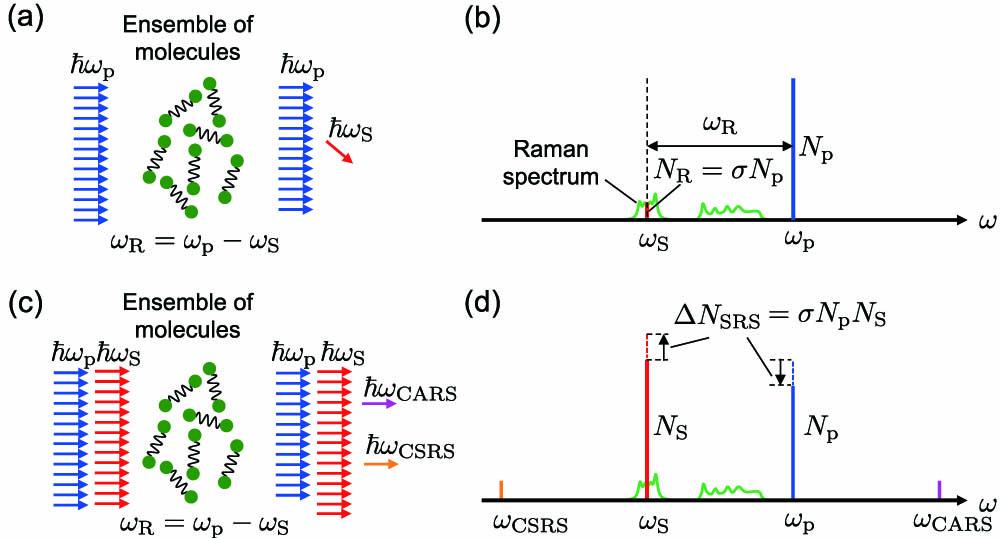
Figure 1 schematically illustrates Raman scattering and CRS including SRS[3]. As shown in Fig. 1(a), when molecules are irradiated with light at an optical angular frequency of , Raman scattering generates light having a frequency of , which is reduced by the vibrational frequency of the molecules (i.e., ). Since molecules have various vibrational resonance frequencies reflecting the vibrational bonds in the molecules, the spectrum of Raman scattering is composed of various peaks, as schematically shown by the green line in Fig. 1(b). CRS is an interaction between two-color light and molecules, as shown in Fig. 1(c). When molecules are irradiated with light at a frequency of (Stokes) in addition to light at a frequency of (pump), the probability of Raman scattering increases in proportion to the number of photons of the Stokes light () compared with spontaneous Raman scattering. As a result, the intensity of the pump light decreases, and the intensity of the Stokes light increases [Fig. 1(d)]. The former effect is called stimulated Raman loss (SRL), and the latter effect is called stimulated Raman gain (SRG). Both effects are also called SRS. Quantitatively, the number of photons of spontaneous Raman scattering in the bandwidth of the Stokes pulses is proportional to the number of photons of pump pulses (), i.e., , where is a proportional constant [Fig. 1(b)]. The number of photons generated or annihilated by SRS is [Fig. 1(d)]. In parallel with SRS, new light is generated at frequencies of and . These are called coherent anti-Stokes Raman scattering (CARS) and coherent Stokes Raman scattering (CSRS), respectively.
Sign up for Chinese Optics Letters TOC. Get the latest issue of Chinese Optics Letters delivered right to you!Sign up now
![Schematics and optical spectra of (a), (b) spontaneous Raman scattering and (c), (d) CRS. Adapted and modified from Ref. [3].](/Images/icon/loading.gif)
Figure 1.Schematics and optical spectra of (a), (b) spontaneous Raman scattering and (c), (d) CRS. Adapted and modified from Ref. [3].
Currently, SRS and CARS are two major mechanisms used in CRS microscopy. In principle, SRS and CARS provide us with the same spectroscopic information and have comparable signal-to-noise ratios[8]. Nevertheless, their features are apparent nowadays. SRS can obtain a Raman scattering signal at a specific vibrational frequency, while the system is more complex because it requires a low-noise laser light source and a dedicated detector to acquire SRS as a slight intensity change of the pump light. In contrast, CARS appears at a frequency different from that of pump light and, therefore, can be detected with a general high-sensitivity detector or a spectrometer without being significantly affected by the intensity noise of the laser source. However, it is known that CARS interferes with an electronic four-wave mixing signal, giving rise to so-called non-resonant background, which distorts the CARS spectrum and makes it difficult to interpret the CARS signal. Recently, it has become possible to acquire broadband CARS spectra using a broadband laser and to correct the spectral distortion through signal processing. For these reasons, it is now recognized that SRS is advantageous for accessing a narrow part of the spectrum, while CARS is advantageous for acquiring a broadband spectrum.
Figure 2 shows a schematic diagram of a typical SRS microscope[3]. Two synchronized pulse lasers are used as light sources. Typically, the pulse width is as a result of compromise between the signal-to-noise ratio (which increases as the pulse width gets shorter[21,22]) and spectral resolution (which gets higher as the spectral width becomes narrower). The typical repetition rate of the pulses is 80 MHz. Typical wavelengths of pump pulse and Stokes pulse range from 700 nm to 1100 nm. The optical power of pump and Stokes pulses irradiating the sample is several tens of milliwatts (mW). After the Stokes pulse train is intensity-modulated, it is combined with the pump pulse train and sent to a microscope through a laser scanning system based on a two-axis galvanometric scanner (GS). Then, the pulses are focused on a sample with an objective lens. When SRS occurs in the focal volume, the intensity modulation of the Stokes light is transferred to the pump light through SRL. The magnitude of the intensity modulation to be transferred is typically of the original pulse intensity (the value of which is based on the author’s experience and matches with those introduced in Ref. [4]), but it varies depending on the type and concentration of molecules in the focal volume. To obtain an SRS signal, the transmitted light is collected by another objective lens. Then, the pump pulse is extracted by an optical filter and received by a photodiode (PD), and its output signal is demodulated by a lock-in amplifier. Typical spatial resolution is about 0.3 μm (which can be further improved by using pulses at shorter wavelengths)[23], and wavenumber resolution is [6,24].
Figure 2.Typical schematic of SRS microscope. PD, photodiode. Adapted and modified from Ref. [3].
Recently, several methods of multicolor SRS microscopy are available, where SRS signals at various vibrational frequencies are acquired to conduct SRS imaging of multiple constituents and analyze tiny spectral features. Figure 3 schematically illustrates the methods of multicolor SRS microscopy[3], which can be categorized into wavelength scanning, spectral focusing, wavelength multiplexing, and modulation-frequency multiplexing. The details of each method are described below.
Figure 3.Multicolor SRS methods based on (a) wavelength scanning, (b) spectral focusing, (c) wavelength-multiplexing, and (d) modulation-frequency multiplexing. Adapted from Ref. [3].
In the wavelength scanning method, SRS images are acquired successively while changing the laser wavelength [Fig. 3(a)][9–12]. In this method, it is crucial to use a high-speed wavelength-tunable pulse source because the imaging speed is limited by the tuning time. One of the advantages of this method is the flexibility in data acquisition. For instance, by continuously scanning the laser wavelength, the SRS spectrum can be obtained in every pixel so that tiny spectral signatures can be detected. We can also discretely change the laser wavelength to reduce the number of spectral points and the acquisition time if a priori knowledge about the sample is available.
The spectral focusing method achieves spectral imaging using two-color chirped femtosecond pulses [Fig. 3(b)][13], which are obtained by passing two-color femtosecond pulses through dispersive materials. The chirped pulses have longer duration (typically several picoseconds) and linearly time-dependent optical frequency. Since the optical frequency difference between them can be kept constant for a long time, the spectral resolution of SRS with the chirped pulses is comparable to the case of two-color picosecond pulses. The advantage of this method is that we can tune the frequency difference by mechanically changing the optical delay, which is technically simpler than wavelength tuning. However, it seems technically challenging to realize high spectral resolution.
The wavelength multiplexing method uses picosecond Stokes pulses and broadband pump pulses [Fig. 3(c)][14] so that SRS at various vibrational frequencies can occur simultaneously. The resultant spectral change of the pump pulses is detected by a spectrometer equipped with a PD array. This method is advantageous in that SRS signal at various vibrational frequencies can be obtained simultaneously, making this method more tolerant to motion artifact compared with the previous two methods.
In the modulation-frequency multiplexing method, different spectral components are intensity-modulated at different frequencies [Fig. 3(d)][15]. Through SRS, modulation transfer occurs simultaneously at various frequencies, and the transferred modulation can be demodulated to obtain SRS signals. Such sophisticated intensity modulation is possible using a rotating polygon mirror, optics, and a specially designed mask pattern[15]. This method is advantageous in that the SRS spectrum can be obtained without using a spectrometer, making this method more tolerant to light scattering caused by the sample than the wavelength multiplexing method.
The author reported an SRS microscope using a high-speed wavelength-tunable pulse source[9,12]. Briefly, we constructed a polarization-maintaining (PM) mode-locked Yb fiber laser using a nonlinear amplified loop mirror with a tunable nonreciprocal phase shifter[12]. The laser generates sub-picosecond pulses at a repetition rate of 38 MHz, which can be controlled by an intracavity electro-optic modulator and a piezoelectric transducer stage. The pulses are amplified and spectrally broadened in a PM fiber, and its group delay across the spectrum is adjusted by a grating pair. Then, a part of the spectrum is filtered and amplified to an average power of ∼120 mW. The optical filter consists of a diffraction grating and a single-axis GS, and the transmission wavelength can be switched within a millisecond by changing the direction of the GS. The wavelength tuning range is from 1014 nm to 1046 nm, which corresponds to the wavenumber tunability of . This Stokes light source was synchronized to a pump light source based on a Ti:sapphire laser generating ∼5 ps pulses at a repetition rate of 76 MHz. Specifically, pump and Stokes pulses are picked up, combined together, and focused on a GaAsP PD to measure the intensity cross correlation via two-photon absorption, which is fed back to the fiber laser to realize a phase-locked loop. The synchronized pump and Stokes pulses are combined and introduced into a video-rate SRS microscope. Note that the repetition frequency of Stokes pulses is half that of pump pulses. This situation is equivalent to the intensity modulation of Stokes pulses at the Nyquist frequency. Such high-frequency modulation is advantageous for high-speed signal acquisition and provides 3 dB sensitivity merit[25]. Using this system, it is possible to acquire Raman images with multiple molecular vibrational frequencies in seconds to tens of seconds by switching the wavelength of the Stokes light source for each frame while acquiring SRS images at 30 frames per second.
Recent applications of SRS microscopy to biomedical imaging are expanding. They can be classified based on the wavenumber regions as follows: (i) carbon–hydrogen (CH)-stretching region (), (ii) fingerprint region (), and (iii) silent region (). The CH-stretching region is most popular because almost all the biomolecules contain carbon and hydrogen. Various applications have been reported including the imaging of lipid accumulation[26–28], tissue[6,9,22,29–31], skin[6,32,33], etc. Notably, SRS can be used to monitor lipid desaturation (i.e., the number of carbon–carbon double bonds), which reflects metabolic states of cancer cells and tissues[6,34,35]. The fingerprint region can be used for acquiring detailed spectroscopic information to discriminate different types of biomolecules, such as cholesterol[36], amyloid plaques[37], drug penetrating into skin[6], and anti-cancer drugs in white blood cancer cells[24]. The silent region, where no biomolecule has a Raman signal, is recently attracting considerable attention because we can realize metabolic imaging and super-multiplex imaging in this region. The metabolic imaging monitors metabolic activity, where cells uptake biomolecules, synthesize functional biomolecules including lipids, proteins, and nucleic acids by biochemical reactions, and digest them. The imaging of such processes has been difficult with fluorescence because fluorescent molecules are big in size, and therefore fluorescent labeling can change the biochemical properties of biomolecules. Instead, by replacing hydrogen atoms in the biomolecules with deuterium atoms (i.e., deuterium labeling), which have almost the same chemical property as hydrogen atoms, we can detect the biomolecules with SRS microscopy because they exhibit carbon–deuterium (CD)-stretching vibrations in the silent region at around [16,17]. Labeling of biomolecules with alkynes (carbon–carbon triple bond)[38] is an alternative approach exploiting the sharp and an order of magnitude stronger spectral response of alkynes at , making the detection of alkynes easier compared with deuterium-labeled molecules[18]. In the super-multiplex imaging, we utilize synthesized Raman-active molecules with distinct spectral peaks to label specific biomolecules, enabling 20-color imaging with SRS microscopy[19,20]. This technique will be useful for elucidating the complex structures and interactions in biological systems.
Figure 4 shows examples of SRS imaging reported by the author and co-workers. Figure 4(a) shows an SRS image of two types of polymer beads in the CH-stretching region () taken in 3 s[12]. Figure 4(b) shows the SRS spectra taken at the pixels shown by the arrows in Fig. 4(a), clearly showing the spectra of poly(methyl methacrylate) and polystyrene. Through pseudoinverse matrix calculation with these spectra, the SRS dataset was decomposed into the color image shown in Fig. 4(a). Figure 4(c) shows the SRS image of acetaminophen-overdosed mouse liver[30]. The SRS image dataset was processed by principal component analysis, and specific components were manually selected to produce multicolor images, where cytoplasm, nuclei, and lipid droplets were shown by green, blue, and yellow, respectively. Figures 4(d) and 4(e) show SRS images of boron cluster cholesterol[39], which is considered for cancer-selective radiotherapy. To acquire the spatial distribution of boron cluster cholesterol, a boron–hydrogen-stretching mode at was detected. We can see the accumulation of the boron cluster cholesterol in the cellular membrane at 2 h [Fig. 4(d)] and the incorporation into the cells at 4 h [Fig. 4(e)]. Figure 4(f) shows an SRS image library of microalgal cells of Euglena gracilis in a high-speed flow at 20 mm/s on a microfluidic chip. To acquire multicolor SRS images in a high-speed flow, we developed a four-color, pulse-pair-resolved, wavelength-switchable laser[40]. This system allows for acquiring an SRS image of within a few minutes and, hence, will be useful for analyzing heterogeneous population of cells.
Figure 4.Examples of SRS imaging reported by the author and co-workers. (a) Hyperspectral SRS image of two types of polymer beads [polystyrene and poly(methyl methacrylate) (PMMA)]. (b) SRS spectra taken at the arrows shown in (a)[12]. (c) Hyperspectral SRS image of acetaminophen-overdosed mouse liver tissue[30]. (d), (e) Uptake of boron cluster compound cholesterol by HeLa cells for (d) 2 h and (e) 4 h[39]. (f) Multicolor SRS imaging flow cytometry of Euglena gracilis cells cultured in different conditions. Green, chlorophyll; red, paramylon; blue, lipid[40].
In summary, this paper has described the principle of SRS microscopy, multicolor SRS imaging methods, and widespread applications of SRS imaging. It is anticipated that future developments on instrumentation and highly sensitive and functional Raman probes will further expand the applications of SRS imaging. Recently, it is also reported that quantum optics (i.e., squeezed light) may be able to enhance the sensitivity[41,42]. Apart from SRS, mid-infrared photothermal microscopy is emerging as a sensitive vibrational imaging method[43,44]. The possibility of molecular vibrational imaging is expanding rapidly and addressing the continuous need of interdisciplinary research including optics, laser engineering, quantum optics, chemistry, biology, and medicine.
References
[1] J.-X. Cheng, X. S. Xie. Science, 350, aaa8870(2015).
[2] C. Zhang, J.-X. Cheng. APL Photon., 3, 090901(2018).
[3] Y. Ozeki, S. Ueno, H. Kano, N. Fukutake. Bioimaging: Imaging by Light and Electromagnetics in Medicine and Biology(2020).
[4] F. Hu, L. Shi, W. Min. Nat. Methods, 16, 830(2019).
[5] A. H. Hill, D. Hu. Anal. Chem., 91, 9333(2019).
[6] C. W. Freudiger, W. Min, B. G. Saar, S. Lu, G. R. Holtom, C. He, J. C. Tsai, J. X. Kang, X. S. Xie. Science, 322, 1857(2008).
[7] P. Nandakumar, A. Kovalev, A. Volkmer. New J. Phys., 11, 033026(2009).
[8] Y. Ozeki, F. Dake, S. Kajiyama, K. Fukui, K. Itoh. Opt. Express, 17, 3651(2009).
[9] Y. Ozeki, W. Umemura, Y. Otsuka, S. Satoh, H. Hashimoto, K. Sumimura, N. Nishizawa, K. Fukui, K. Itoh. Nat. Photon., 6, 845(2012).
[10] L. J. Kong, M. B. Ji, G. R. Holtom, D. Fu, C. W. Freudiger, X. S. Xie. Opt. Lett., 38, 145(2013).
[11] D. L. Zhang, P. Wang, M. N. Slipchenko, D. Ben-Amotz, A. M. Weiner, J. X. Cheng. Anal. Chem., 85, 98(2013).
[12] Y. Ozeki, T. Asai, J. Shou, H. Yoshimi. IEEE J. Sel. Top. Quantum Electron, 25, 7100211(2019).
[13] D. Fu, G. Holtom, C. Freudiger, X. Zhang, X. S. Xie. J. Phys. Chem. B, 117, 4634(2013).
[14] C. S. Liao, M. N. Slipchenko, P. Wang, J. Li, S. Y. Lee, R. A. Oglesbee, J. X. Cheng. Light Sci. Appl., 4, e265(2015).
[15] C. S. Liao, P. Wang, P. Wang, J. Li, H. J. Lee, G. Eakins, J. X. Cheng. Sci. Adv., 1, e1500738(2015).
[16] J. Li, J. X. Cheng. Sci. Rep., 4, 6807(2014).
[17] L. Zhang, L. Shi, Y. Shen, Y. Miao, M. Wei, N. Qian, Y. Liu, W. Min. Nat. Biomed. Eng., 3, 402(2019).
[18] L. Wei, F. Hu, Y. Shen, Z. Chen, Y. Yu, C. C. Lin, M. C. Wang, W. Min. Nat. Methods, 11, 410(2014).
[19] L. Wei, Z. Chen, L. Shi, R. Long, A. V. Anzalone, L. Zhang, F. Hu, R. Yuste, V. W. Cornish, W. Min. Nature, 544, 465(2017).
[20] F. Hu, C. Zeng, R. Long, Y. Miao, L. Wei, Q. Xu, W. Min. Nat. Methods, 15, 194(2018).
[21] D. Zhang, M. N. Slipchenko, J. -X. Cheng. J. Phys. Chem. Lett., 2, 1248(2011).
[22] A. Francis, K. Berry, Y. Chen, B. Figueroa, D. Fu. PLoS ONE, 12, e0178750(2017).
[23] Y. Bi, C. Yang, Y. Chen, S. Yan, G. Yang, Y. Wu, G. Zhang, P. Wang. Light Sci. Appl., 7, 81(2018).
[24] D. Fu, J. Zhou, W. S. Zhu, P. W. Manley, Y. K. Wang, T. Hood, A. Wylie, X. S. Xie. Nat. Chem., 6, 614(2014).
[25] Y. Ozeki, Y. Kitagawa, K. Sumimura, N. Nishizawa, W. Umemura, S. Kajiyama, K. Fukui, K. Itoh. Opt. Express, 18, 13708(2010).
[26] M. C. Wang, W. Min, C. W. Freudiger, G. Ruvkun, X. S. Xie. Nat. Methods, 8, 135(2011).
[27] D. Fu, Y. Yu, A. Folick, E. Currie, R. V. Farese, T. H. Tsai, X. S. Xie, M. C. Wang. J. Am. Chem. Soc., 136, 8820(2014).
[28] Y. Wakisaka, Y. Suzuki, O. Iwata, A. Nakashima, T. Ito, M. Hirose, R. Domon, M. Sugawara, N. Tsumura, H. Watarai, T. Shimobaba, K. Suzuki, K. Goda, Y. Ozeki. Nat. Microbiol, 1, 16124(2016).
[29] C. W. Freudiger, R. Pfannl, D. A. Orringer, B. G. Saar, M. Ji, Q. Zeng, L. Ottoboni, W. Ying, C. Waeber, J. R. Sims, P. L. De Jager, O. Sagher, M. A. Philbert, X. Xu, S. Kesari, X. S. Xie, G. S. Young. Lab. Invest., 92, 1492(2012).
[30] S. Satoh, Y. Otsuka, Y. Ozeki, K. Itoh, A. Hashiguchi, K. Yamazaki, H. Hashimoto, M. Sakamoto. Pathology Int., 64, 518(2014).
[31] T. C. Hollon, B. Pandian, A. R. Adapa, E. Urias, A. V. Save, S. S. S. Khalsa, D. G. Eichberg, R. S. D’Amico, Z. U. Farooq, S. Lewis, P. D. Petridis, T. Marie, A. H. Shah, H. J. L. Garton, C. O. Maher, J. A. Heth, E. L. McKean, S. E. Sullivan, S. L. Hervey-Jumper, P. G. Patil, B. G. Thompson, O. Sagher, G. M. McKhann, R. J. Komotar, M. E. Ivan, M. Snuderl, M. L. Otten, T. D. Johnson, M. B. Sisti, J. N. Bruce, K. M. Muraszko, J. Trautman, C. W. Freudiger, P. Canoll, H. Lee, S. Camelo-Piragua, D. A. Orringer. Nat. Med., 26, 52(2020).
[32] B. G. Saar, C. W. Freudiger, J. Reichman, C. M. Stanley, G. R. Holtom, X. S. Xie. Science, 330, 1368(2010).
[33] M. Egawa, S. Iwanaga, J. Hosoi, M. Goto, H. Yamanishi, M. Miyai, C. Katagiri, K. Tokunaga, T. Asai, Y. Ozeki. Sci. Rep., 9, 12601(2019).
[34] J. Li, S. Condello, J. Thomes-Pepin, X. Ma, Y. Xia, T. D. Hurley, D. Matei, J. X. Cheng. Cell Stem Cell, 20, 303(2017).
[35] S. Yan, S. Cui, K. Ke, B. Zhao, X. Liu, S. Yue, P. Wang. Anal. Chem., 90, 6362(2018).
[36] P. Wang, J. Li, P. Wang, C. R. Hu, D. Zhang, M. Sturek, J. X. Cheng. Angew. Chem. Int. Ed., 52, 13042(2013).
[37] M. Ji, M. Arbel, L. Zhang, C. W. Freudiger, S. S. Hou, D. Lin, X. Yang, B. J. Bacskai, X. S. Xie. Sci. Adv., 4, eaat7715(2018).
[38] H. Yamakoshi, K. Dodo, A. Palonpon, J. Ando, K. Fujita, S. Kawata, M. Sodeoka. J. Am. Chem. Soc., 134, 20681(2012).
[39] T. Asai, H. Liu, Y. Ozeki, S. Sato, T. Hayashi, H. Nakamura. Appl. Phys. Express, 12, 112004(2019).
[40] Y. Suzuki, K. Kobayashi, Y. Wakisaka, D. Deng, S. Tanaka, C.-J. Huang, C. Lei, C.-W. Sun, H. Liu, Y. Fujiwaki, S. Lee, A. Isozaki, Y. Kasai, T. Hayakawa, S. Sakuma, F. Arai, K. Koizumi, H. Tezuka, M. Inaba, K. Hiraki, T. Ito, M. Hase, S. Matsusaka, K. Shiba, K. Suga, M. Nishikawa, M. Jona, Y. Yatomi, Y. Yalikun, Y. Tanaka, T. Sugimura, N. Nitta, K. Goda, Y. Ozek. Proc. Natl. Acad. Sci. U.S.A., 116, 15842(2019).
[41] R. B. de Andrade, H. Kerdoncuff, K. Berg-Sørensen, T. Gehring, M. Lassen, U. L. Andersen. Optica, 7, 470(2020).
[42] C. A. Casacio, L. S. Madsen, A. Terrasson, M. Waleed, K. Barnscheidt, B. Hage, M. A. Taylor, W. P. Bowen(2020).
[43] D. Zhang, C. Li, C. Zhang, M. N. Slipchenko, G. Eakins, J.-X. Cheng. Sci. Adv., 2, e1600521(2016).
[44] M. Tamamitsu, K. Toda, H. Shimada, T. Honda, M. Takarada, K. Okabe, Y. Nagashima, R. Horisaki, T. Ideguchi. Optica, 7, 359(2020).