Key Laboratory of Space Laser Communication and Detection Technology, Shanghai Institute of Optics and Fine Mechanics, Chinese Academy of Sciences, Shanghai 201800, China
Zhiyong Lu, Jianfeng Sun, Yu Zhou, Ning Zhang, Zhiwei Sun, Liren Liu, "Visualized measurement of the electric field in large aperture LiNbO3 crystal by digital holographic interferometry," Chin. Opt. Lett. 13, 020901 (2015)
Copy Citation Text
The electric field distribution in crystal under different electrode shape is presented by using the digital holographic interferometry. Three configurations of phase modulator including the rectangular electrode type, single-triangle electrode type, and dual-triangle electrode type are performed in this experiment. The nonuniform electric field distribution in these phase modulators are observed and the electric field increases with voltage increasing. The digital holographic interferometry with high electro-optic effect improves the measurement precision. The digital holographic interferometry provides an effective way for studying the electric field distribution. Such in situ quantitative analysis of electric field distribution is a key to optimizing electrode shape.
The property of electric-field tunable refractive index, also called the electro-optic effect, is currently of great interest for light modulation at high operating speed (intrinsic response speeds of ). Electro-optic modulation technology is widely used in many devices, such as optical communication devices[1], switches[2], optical scanners[3] etc., to perform various functions in the transmission and processing of electrical and optical signals. In high power laser application, in order to obtain high quality and high power laser, large aperture electro-optic modulator is used to control and correct distorted laser phase[4]. The laser energy is too high, waveguide electro-optic modulator would have nonlinear effect and thus be less paid attention to. So the transversal area of the modulator must increase with the increasing energy correspondingly. The electric field distribution in large aperture modulators would change and urgently need to be measured.
Laser beam scanner based on electro-optic modulation possesses triangular up-and-down electrode structure[5]. The electro-optic effect controls the refractive index variation in the electrode area and makes the transmission beam obtain the gradient phase distribution. It is very useful in down-looking synthetic aperture imaging ladar[6]. However, since the index change is typically small, high voltage has to be applied. With the increase of applied voltage, the electric field integral along the beam propagation direction present gradient distribution. Then, the spatial phase distribution could be controlled accurately.
In recent years, digital holographic interferometry has been widely used to measure the acoustic levitation field, refractive index distribution, effective crystal internal field, laser-induced domain nucleation, MEMS, and so on[7–12]. Tran et al.[13] primarily measured the surface discharge distribution with low coefficient. Lo et al.[14] measured the GaAs semi-insulating surface property with CW electro-optic probing, but his set up is very complicated and low sensitive. is the largest electro-optic coefficient in crystal, and is about 3 times of when illuminated by extraordinary light. Phase modulation is very obvious to using the extraordinary s-polarized light with an applied electric field. It is widely used in different kinds of modulation.
Sign up for Chinese Optics Letters TOC. Get the latest issue of Chinese Optics Letters delivered right to you!Sign up now
In this Letter, three types of electrode shape were produced. And the extraordinary s-polarized light was used. The phase distribution of crystal under the three types of electrode was obtained. The electric field integral along the beam propagation direction were reconstructed by using the digital holographic interferometry.
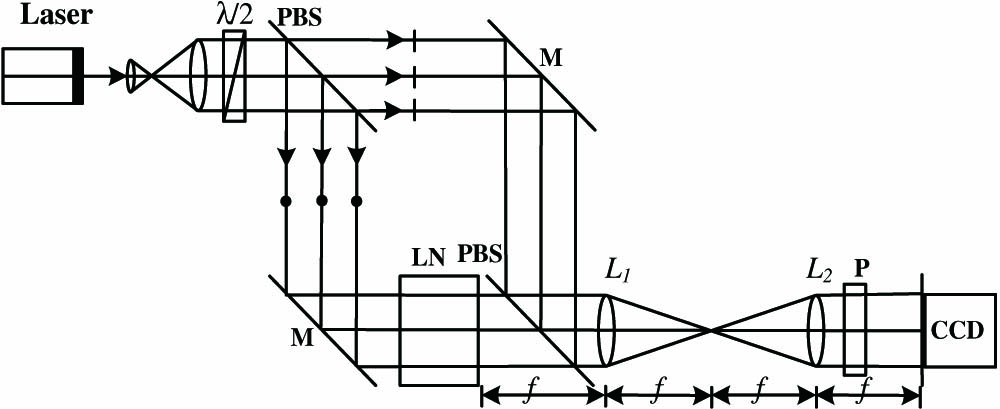
Figure 1 shows the experimental set-up. A He–Ne laser beam () is expanded and collimated through a reversed telescope. The beam from the reversed telescope propagates through the half-wave plate (HWP) and polarization beam splitter (PBS), then the beam is equally divided by the PBS into two beams with orthogonal polarizations, which constitutes a polarization Mach–Zehnder interferometer configuration. Lenses and form systems, respectively. The rear face of crystal is placed at the front focal plane of lens . The horizontally polarized beam and the vertically polarized beam are combined by the second PBS. The combined beam passes through the analyzer generating interference patten collected by the CCD camera. The high sensitive photo-sensing plane of the CCD camera with a pixel array (about μ pitch) and is placed at the rear focus plane of lens to record the image holograms. The vertically polarized beam propagating through the crystal sample acts as the object beam, and the other beam as the reference beam. The polarizations of the vertically polarized beam are parallel to the axis of the crystal, to detect the extraordinary index changes with different applied electric field. The electro-optic coefficient of extraordinary polarized light is larger than other electro-optic coefficient. The refractive index changes is more obvious when the e-polarized light propagates through the phase modulator under the axis electric field.
Figure 1.Experimental set-up for visualization of electric field distribution in phase modulator.
In the experimental process, first, the horizontally polarized beam and the vertically polarized beam are coaxially recombined, The propagation direction of the horizontally polarized light was adjusted. The angle between the horizontally polarized beam and the vertically polarized beam is about 1°. Secondly, the electrode was closed to the crystal along the z direction, and a adjustable voltage was be used, Finally, the CCD camera recorded a frame per 50 V. The largest voltage is 3200 V.
The sample holder used for the experiments is illustrated by Fig. 2. The crystal sample, which is a z-cut with 4-mm-thick, 12-mm-width, 60-mm-length. A rectangular stop is placed in front of the crystal. In the experiment, We made three types of electrode shapes including rectangular electrode type, single-triangle electrode type and dual-triangle electrode type to supply external field. The rectangle electrode is made of copper with 0. 1-mm-thick, 12-mm-width, 60-mm-length, the triangle electrode is also made of copper with 0. 1-mm-thick, 10-mm-width, 60-mm-length. The electrode connection of the is showed by Fig. 2. The dynamic phase-mapping in crystal phase modulators under different applied voltage are recorded, then the electric field distribution could be reconstructed from the phase maps.
Figure 2.Three types of electrio-optic phase mudulators. (a) Rectangular electrode type; (b) single-triangle electrode type and (c) dual-triangle electrode type.
In the case of the digital holographic interferometry the intensity of the hologram on the CCD plane is where is the background illumination, is the amplitude modulation of the fringes, is the phase of the test object, is the spatial frequency, and . Then, applying the Fourier transform we will have where is the spectrum of the background illumination, and contain the spectra of the deformed object. In order to retrieve the phase information, the filtering, shifting and inverse Fourier transform are carried out from the following equations
From the Eq. (4), we can obtain the corresponding wrapped phase distribution, then Branch–Cut Method is used to unwrap the object phase. In our experiment, the extraordinary index of crystal is controlled by the external electric field. In the absence of an electric field, the extraordinary index of crystal is constant. However, an electric field across the crystal along the z direction would change the refractive index. The changes induce the phase retardation of the normally incident plane wave. For a crystal, the phase retardation between the waves passing through (in y direction) in its two different states can be described by , The optical path difference is generally described as a line integral of the refractive index variation , where and and denote the initial and changed refractive indexes, respectively. Once obtained, can be further used for calculating the electric field distribution. The incident beam pass through the , in a cross section, the relationship of the phase retardation versus the change of the refractive index induced by the external electric field is expressed as
Under the external electric field, the refractive index is changed as
So the phase distribution of the crystal under the external electric field is
From above analysis, it is known that the refractive index distribution of the crystals can be converted into the phase distribution of the object wavefront.
For the parallel electrodes applied on the surface of the cuboid crystal, the line integral of the electric field distribution can be obtained by where is the equivalent electric field distribution. Meanwhile, the electric field distribution is different in the three electrode types. The electric field under the rectangular electrode is , which is a constant. For the triangle electrode, the electric field distribution lies on the part crystal under the electrode. Triangular electrode regions with different indices of refraction are created with an applied voltage via the electro-optic effect. This modulator and linear gradient scanners have the same performance if they have the same device dimension and maximum index difference[15]. So the line integral of the electric field distribution is equivalent to the gradient electric field, which is increasing linearly from up to down. The electric field distribution is about , (), where is related to the number of triangle electrode. For the duel-triangle electrode, two triangular electrode regions are defined by opposite voltage orientations in a single crystal, so the line integral of the electric field distribution is about two times than single-triangle electrode. The visualized measurement of the electric field was demonstrated by the following experiment.
Dynamic electric field integral along the beam propagation direction under the rectangular electrode was measured at different applied voltages. Figure 3 shows the selected sequence of reconstructed electric field integral along the beam propagation direction during the increasing voltage applied on the crystal. As can be observed, the electric field integral distribution are flat and smooth at the center, and is more uneven far away from the center. With the increase of the applied voltage, the electric field integral distribution bends more seriously, which means that index changes under the applied field are not all uniform. One reason is the initial refractive indexes are nonuniform. Another mostly possible reason is that the limited size of the electrode induces complicated fringing field effect, in which surface discharge distribution is not uniform, with more charge distribution on the edge of the electrode. Compare with the traditional numerical calculation in fringing field effect, this newly proposed approach could provide simultaneous information about the edge-effect and in situ monitoring the electric field distribution in crystals. In practical applications, this method can be used to optimize the size and shape of the electrode, and then make a quality phase modulation.
Figure 3.Selected sequence of reconstructed electric field integral distributions under different applied voltages in the crystal with rectangular electrode. The applied voltage is (a) 800, (b) 1600, (c) 2400, and (d) 3200 V.
Electro-optic deflector with triangular electrode would cause the transmission beam deflection at the interface, so it is widely used in the electro-optic deflector. The linear phase shift of the beam in the deflector makes the beam deflect in the far field. When the single-triangle electrode was made on the face of the crystal, only the refractive index of the under the triangle electrode could be changed, and the phase retardation is not symmetrical, resulting in the beam translation in addition to the deflection. Moreover, high external electric field causes additional nonuniform electric field space distribution except the linear one. Figure 4 shows the selected sequence of reconstructed electric field integral distributions during the increasing applied voltage in the crystal. As shown by Fig. 4, the electric field integral distributions generate linear change along the x direction, but we can also find some nonuniform phase changes on the edge of the electrode. With the increase of the applied voltage, the external electric field integral distribution becomes more distorted, bending more seriously.
Figure 4.Selected sequence of reconstructed electric field integral distributions under different applied voltages in the crystal with single-triangle electrode. The applied voltage is (a) 800, (b) 1600, (c) 2400, and (d) 3200 V.
Electro-optic deflector with dual-triangular electrode could achieve larger scanner angle, resulting from the more obvious linear phase shsift. In this section, the electric field integral along the beam propagation direction under various applied voltage is also achieved by polarized digital holographic interferometry in crystal under the dual-triangle electrode. Figure 5 shows the selected sequence of electric field integral distributions in crystal. With the increasing applied voltage, electric field integral distribution is linearly changed. At the same time, the electric field integral distribution bends and changes nonuniformly. Compared with the experimental results show in Figs. 4 and 5, the electric field integral with dual-triangular electrode is about two times more than the one with a single-triangular electrode. However, the nonuniform distribution is also more serious, so we suggest that central region should be used to obtain the uniform phase modulation.
Figure 5.Selected sequence of reconstructed electric field integral distributions under different applied voltages in the crystal with dual-triangle electrode. The applied voltage is (a) 800, (b) 1600, (c) 2400, and (d) 3200 V.
In conclusion, the digital holographic interferometry is proposed to monitor and calculate the electric field integral distribution along the beam propagation direction. Dynamic nonuniform electric field integral distribution in phase modulation under three types of electrode and different applied voltage are measured. Electric field integral distribution under the rectangular electrode has higher value on the edge of the electrode and lower value in the center of the electrode. The higher applied voltage, the more distorted electric field integral distribution. Such electric field integral distribution is a key to optimizing electrode shape. In the future, we can receive interference pattern in different incident angle by rotating the crystal. Then the line integral of the electric field in different incident angle would be obtained using above method. At last, three-dimensional electric field distribution would be reconstructed by Radon–Fourier transform which is widely used in medical CT technology. This is our next major work.
Zhiyong Lu, Jianfeng Sun, Yu Zhou, Ning Zhang, Zhiwei Sun, Liren Liu, "Visualized measurement of the electric field in large aperture LiNbO3 crystal by digital holographic interferometry," Chin. Opt. Lett. 13, 020901 (2015)