1Science and Technology on Electronic Test & Measurement Laboratory, The 41st Research Institute of CETC, Qingdao 266555, China
2School of Information Science & Engineering and Shandong Provincial Key Laboratory of Laser Technology and Application, Shandong University, Jinan 250100, China
3Institute of Applied Electronics, China Academy of Engineering Physics, Mianyang 621900, China
A double-pass grating imaging spectrometer is proposed and demonstrated. The traditional entrance slit is replaced by a middle reflective slit, which is used as a spectral filter rather than a spatial filter. The light from the scene passes through the same dispersive grating twice. The full image of the scene can be obtained with a snapshot. Therefore, the stripe noise and image distortion caused by image mosaicking can be eliminated. Besides, the target is easier to be captured and focused, just like using a camera. This method can be used to obtain clearer spectral images of the scene conveniently and quickly.
A grating imaging spectrometer is a powerful tool to record the spectral cube of the scene in visible and near-infrared spectral bands. It has been widely used in laboratory and industry, such as biotechnology and remote sensing[1–4]. In order to improve system performance, methods with novel designs for a grating imaging spectrometer have been proposed to reduce aberrations in recent years[5–9].
However, some problems caused by traditional work mode still reduce the performance of the grating image spectrometer. Traditionally, the spectral cube is first spatially filtered by a slit. Then, a slice along the spectral axis of the spectral cube is constructed by a dispersion grating. So, the full image of the scene cannot be captured with a snapshot. As a result, additional equipment is required to focus and observe the target scene, which increases the complexity of the system. Besides, the stripe noise and image distortion often appear to be caused by traditional image mosaicking[10]. In addition, the width of the slit is inversely proportional to the radiation throughput, and at the same time, it is proportional to the spatial resolution. These problems lead to a contradiction between the radiation throughput and the spatial resolution: the higher the former, the lower the latter, and vice versa[11].
A windowing push-broom hyperspectral imager has been proposed by Couce et al.[12]. The full images of the scene can be captured by adding a grating before the traditional imaging spectrometer. One grating is used for dispersion modulation. The other is used for dispersion demodulation. In order to capture high quality spectral filtering images, the two gratings must have the same specifications. At the same time, the incidence angles of the two gratings must be the same. Otherwise, the spectral filtering image captured by the camera is still distorted.
Sign up for Chinese Optics Letters TOC. Get the latest issue of Chinese Optics Letters delivered right to you!Sign up now
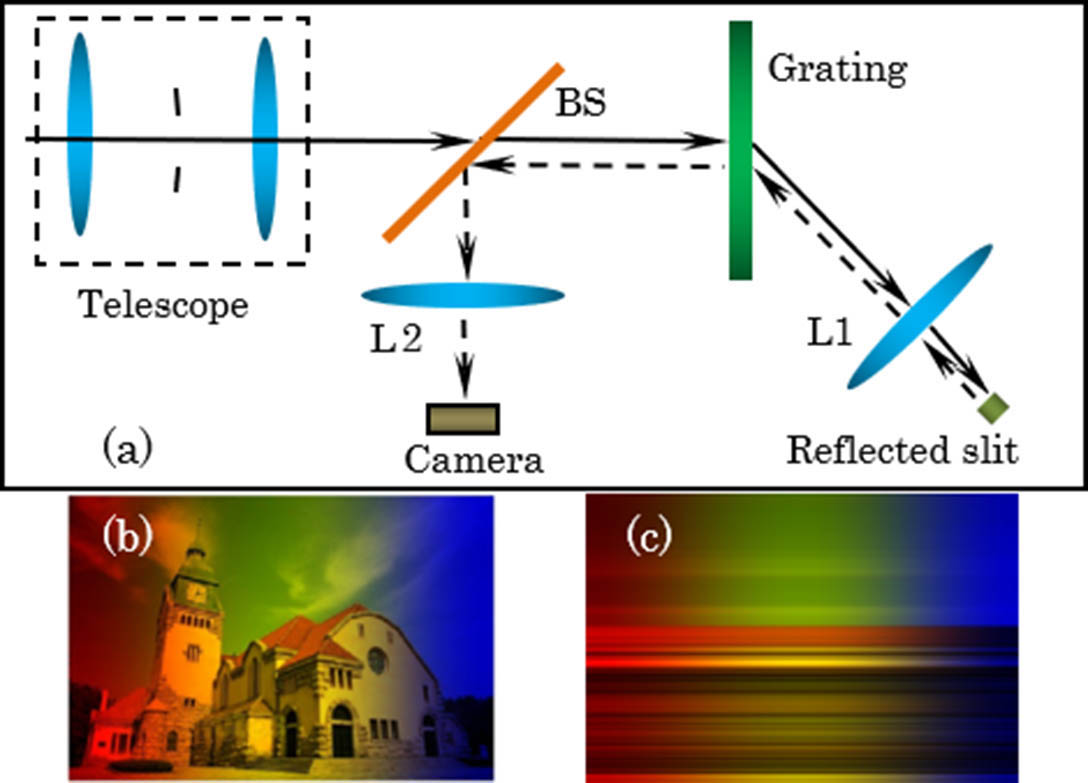
In this Letter, a double-pass grating imaging spectrometer is proposed to eliminate distortion of spectral images. The schematic of the proposed method is shown in Fig. 1(a), which is used as a proving system. The system is composed of a telescope, a beam splitter, a dispersive grating, a reflective slit, and an imaging system. The dispersive grating and the reflective slit are used for the generation of an oblique slice of the spectral cube, which are the key components. The imaging system is used to record light intensity. The full image of the scene can be captured with a snapshot, as shown in Fig. 1(b), followed by the image captured by a traditional grating imaging spectrometer in Fig. 1(c). The spectrum mosaicking takes the place of traditional image mosaicking so that we can obtain the image of the scene snapshot. The same grating is used for both dispersion modulation and dispersion demodulation to ensure that the image is not distorted.
Figure 1.Schematic layout of the double-pass grating imaging spectrometer. (a) Schematic of the present method; (b) simulation of the captured image by the proposed method with a snapshot; (c) simulation of the captured image obtained by the traditional grating imaging spectrometer with a snapshot.
For reconstructing the spectral cube of the scene, push-broom scanning is necessary. The spectral curve of each point on the scene can be obtained by moving the reflected slit along the direction perpendicular to the grating line.
The spectral cube of the scene can be described as , where represents the two-dimensional spatial coordinates, and is the wavelength. The light from the scene is first collimated by the front optical system, such as a telescope optical system, ensuring that parallel light is launched into the grating. The spectral cube can be replaced by , where and are the fields of view (FOV) of point . The parallel light beam of the point then passes through the beam splitter and the grating in sequence. Based on the grating equation, the dispersive light can be expressed as where is the grating constant, and and are the entry angle and exit angle of the light with respect to the direction of the grating line, respectively. The diffraction order is represented by .
Then, the output light from the grating is focused on the focal plane of L1. Because of the absence of the input slit in front of the dispersive grating, the spectral filtering image is aliasing along the direction. On the dimension, the image is focused normally. A reflective slit parallel to the grating line is placed on the focal plane of L1. So, a row of the spectral image is filtered by the slit. It contains the full image of the scene. Assuming that the angle of the optical axis of L1 with respect to the normal of the grating is , which is the diffraction angle of the middle wavelength of the spectral band when the entry angle is equal to 0°, the relationship between the wavelength and the FOV of the point can be expressed as where is the FOV of the reflective slit. It is decided by the position of the reflected slit located on the focal plane of L1. The row of the spectral image reflected by the slit is the superposition of each row of the scene with different spectral bands. The reflected light then passes through L1 and travels into the grating again. According to the grating function, the output light from the secondary dispersive grating can be expressed as where and are the entry and exit angles with respect to the direction of the grating line, respectively. The light passes through the secondary grating. The input light reflected by the slit will be dispersion demodulated, passing the grating again. Furthermore, the light with different wavelengths has different exit angles because the entry angle of the input light is equal to . According to Eqs. (2) and (3), we can obtain the expression of the exit angle of the light and the relationship between the exit angle and the wavelength when the light passes through the grating for the second time:
The emergent angle from the secondary grating is equal to the entry angle of the system . So, we can obtain the full image of the scene with a snapshot by the objective lens L2. Due to a fact that the wavelength of each row of the image is different, we can capture an oblique slice of the three-dimensional spectral cube at once, which contains the full image of the scene without imaging mosaicking.
When the entry angle is fixed, we can obtain the equation of spectral resolution by differential calculations according to Eq. (4b): where is the variable of the exit angle. It is decided by the width of the reflected slit and can be expressed approximately as where is the width of the slit, and is the focal length of L1. Because the FOV is usually much smaller than the angle , the grating constant according to Eq. (2) can be presented as
According to Eqs. (5)–(7), the spectral resolution of the system can be rewritten as
The spectral resolution is proportional to the focal length of L1 and inversely proportional to the width of the reflected slit. In the actual application process, the width of the slit should not be less than the radius of the spot diagrams of the imaging system. Otherwise, the spectral resolution will be inversely proportional to the radius of the spot diagrams.
The spectral width is limited by the grating constant and the FOV on the dimension. When the location of the reflected slit is fixed, is fixed and can be presented by a constant . So, Eq. (4b) can be rewritten as
Assuming that the FOV on the dimension is from to , the spectral width can be expressed as
The dispersive wavelength is related to the entry angle of the light and FOV of the slit . So, two push-broom modes can be used to acquire the whole spectral cube of the scene. First, we can change the reflected angle to obtain the spectral curve by moving the reflected slit along the direction perpendicular to the grating line. Besides, the spectral curve of each point on the scene can be acquired by rotating the system to change the entry angle . If the view field of the system is small enough, the wavelength is a linear variation along the FOV .
For a traditional grating imaging spectrometer, the spatial resolution along the FOV of the imaging system is limited by the width of the input slit. However, the spatial resolution is not affected by the width of the reflected slit in the presented imaging system. The FOV of the output light is not influenced by the reflected slit, and it is only equal to the view field of input light.
A simple verifying simulation system is set up with Zemax OpticStudio, as shown in Fig. 2. The grating constant is 10 μm, and the width of the reflected slit is 0.5 mm.
Figure 2.Schematic layout of the simulation system using the software Zemax OpticStudio.
The input scene is shown in Fig. 3(a). The response spectral band of the simulation system is in visible spectral bands. The orientation of the grating line is horizontal. The captured color image on the focal plane of L2 is shown in Fig. 3(b) followed by the grayscale image, as shown in Fig. 3(c). The full image of the scene is captured with a snapshot. The left part of the image is red filtered, the middle part of the image is green filtered, and the right part of the image is blue filtered.
Figure 3.Result of the simulation system. (a) The input scene; (b) the captured color image of the scene in one shot; (c) the captured gray image of the scene in one shot.
The captured image of the presented spectrometer is some like the one captured by the wedge imaging spectrometer[13]. Compared with a gradient filter, grating dispersive spectroscopy has higher spectral resolution and higher cost performance. The simple simulation proves the feasibility of the present method.
Then, we designed a simple experimental prototype to demonstrate the presented method. The focal lengths of L1 and L2 are 75 mm. A transmission blaze grating with 600 grooves from Edmundoptics (Product No. 49-580) is used as the dispersive element. The digital camera from Princeton Instruments (Product No. Pro EM ) is used to capture the image of the scene. The width of the reflected slit is about 0.25 mm. The average spectral resolution is about 5 nm in the visible light. A red semiconductor laser and a green semiconductor laser are used as the light source. One captured image of a whiteboard illuminated by the laser source is shown in Fig. 4.
Figure 4.Spectral image of two semiconductor lasers.
Two spectral lines are obvious on the image. The wavelengths of the left band and the right band are about 633 and 531 nm, respectively.
Then, a color picture, as shown in Fig. 5(a), is used as the target. An incandescent lamp is used as the light source. The full scene is captured with a snapshot, as shown in Fig. 5(b). There is no strip noise and image distortion.
Figure 5.Result of the experimental system. (a) The scene of a color picture; (b) one captured gray image of the scene in one shot.
In the experiment, the reflective slit is moving along the direction perpendicular to the grating line. A series of spectral filtering images of the scene are captured. Figure 6 shows four spectral filtered images. The scene of the target is fixed, and the spectral window moves from one side to the other.
Figure 6.Four spectral filtered images of the target.
The spectral cube of the scene is reconstructed after the push-broom. The spectral curve of point A in Fig. 5(a) is shown as the black dashed curve in Fig. 7. The spectral curve of point B in Fig. 5(a) is shown as the red solid line in Fig. 7. It is evident that the experimental result is in agreement with the theoretical value and proves the principle of the method.
Figure 7.Recovery spectral curves of points A and B, as shown in Fig. 5.
The feasibility of the proposed method has been proved by the simulation and experiment, but the following factors should be considered. First, the noise of the captured images in the experiment is mainly caused by the stray light, especially the reflected light from the grating. The width of the reflected slit can be reduced enough to improve the spectral resolution when the advanced system is designed.
In summary, we have suggested a double-pass grating imaging spectrometer to improve the quality of the spectral images. The structure and working mode of the proposed method are different from the traditional grating imaging spectrometer. The most significant advantage of this method is that the stripe noise and image distortion caused by image mosaicking can be eliminated because the full image of the scene can be captured with a snapshot. In addition, this method benefits from traditional grating imaging spectrometers as well. It will be a powerful tool to record the spectral cube of the scene in visible and near-infrared spectral bands for laboratory and microscopic imaging spectral testing.