
Jun FU, Hong-xiang HAN. Modified Adaptive Real-time Filtering Algorithm for MEMS Gyroscope Random Noise[J]. Acta Photonica Sinica, 2019, 48(12): 1212003
- Acta Photonica Sinica
- Vol. 48, Issue 12, 1212003 (2019)
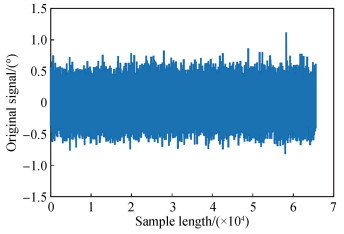
Fig. 1. 3DM-GX4-25 X 轴预处理后数据3DM-GX4-25 X -axis post-preprocessing data
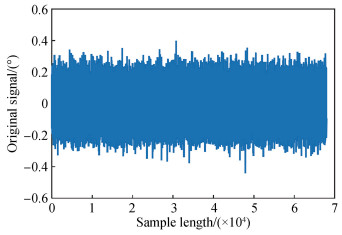
Fig. 2. MTi-100 X 轴预处理后数据MTi-100 X -axis post-preprocessing data
Fig. 3. Triaxial rate turntable and device packaging
Fig. 4. MTi-100 sensor gyro X -axis ARMA model parameters online update curve
Fig. 5. Comparison of output data before and after X -axis filter of MTi-100 gyro
Fig. 6. Comparison of output data before and after X -axis filter of 3DM-GX3-25 gyro
Fig. 7. Comparison of output data before and after X -axis filter of MTi-100 gyro
Fig. 8. Comparison of output data before and after X -axis filter of 3DM-GX3-25 gyro
|
Table 1. Output mean of two MEMS gyro
|
Table 2. The traditional method of model identification
|
Table 3. The traditional method of model identification
|
Table 4. Statistical characteristics of gyro output signal before and after filtering
|
Table 5. Statistical characteristics of gyro output signal before and after filtering

Set citation alerts for the article
Please enter your email address
© Copyright 2018-2021 | Chinese Laser Press. All Rights Reserved 沪ICP备15018463号-20