• Chinese Optics Letters
  • Vol. 16, Issue 11, 111901 (2018)
Liwen Sheng, Dexin Ba*, and Zhiwei Lü**
Author Affiliations
  • National Key Laboratory of Science and Technology on Tunable Laser, Harbin Institute of Technology, Harbin 150001, China
  • show less
    DOI: 10.3788/COL201816.111901 Cite this Article Set citation alerts
    Liwen Sheng, Dexin Ba, Zhiwei Lü. Weak laser pulse signal amplification based on a fiber Brillouin amplifier[J]. Chinese Optics Letters, 2018, 16(11): 111901 Copy Citation Text show less

    Abstract

    We propose a high-gain and frequency-selective amplifier for a weak optical signal based on stimulated Brillouin scattering in a single mode fiber. To be able to satisfy the needs of high gain and high signal-to-noise ratio laser pulse amplification, different fiber lengths and core diameters are used to fulfill this experiment. In the experiment, a 430 nW (peak power) pulsed signal is amplified by 70 dB with a signal-to-noise ratio of 14 dB. The small size, high gain, low cost, and low noise of the fiber Brillouin amplifier make it a promising weak signal amplification method for practical applications such as lidar.

    Brillouin amplification has been a subject of interest because of its ability to amplify weak pulse signals with a high magnification[14] and strong signals with a high efficiency[5,6]. It has potential applications in intelligent driving systems[79] and lidar detection systems[1014]. Lidar is an excellent system for high-resolution detection. The quantity of echo signals of lidar depends heavily on the surrounding environment, such as weather and air conditions. Up until now, most lidar systems mainly employed electrical amplification to detect weak echo signals, which required a highly sensitive detector[15,16]. However, high sensitivity brings more background noise and restricts the working conditions of the detector, such as low temperature.

    Stimulated Brillouin scattering (SBS) is a relatively simple and efficient mechanism for weak optical signal amplification with a high gain and high signal-to-noise ratio (SNR). According to various references, the results show the possibility of using a Brillouin amplifier to enhance weak signals[1720]. About a 2×10⁹ signal amplification factor was achieved for an input signal of 1 pJ[17]. By using the double-stage non-collinear Brillouin amplification system, a Stokes signal of 8.6×10¹⁴J was amplified with an overall signal amplification factor of 1011[18]. Image amplification by a factor of 300 was demonstrated with Brillouin two-beam coupling in CS2[19]. With a pump power at the threshold, the Brillouin amplifier can provide a very high gain: a gain of 45 dB was obtained with 8 dBm of pump power in a 25 km single mode fiber (SMF) for a 45dBm input power signal[20]. Those experiments involved a high pump power density to amplify the Stokes pulse. Therefore, pulsed pumps were employed. However, for a real lidar system, it is hard to synchronize the pump and echo signals, because the time when the echo signals reach the SBS amplifier is unknown.

    In this Letter, we propose a high gain scheme based on SBS in an optical fiber that employs a continuous-wave (CW) pump to amplify the weak signals to obtain a higher magnification than done previously[20]. It has the following two main advantages: (1) the intrinsic linewidth of the optical fiber is only 30MHz, so the SBS amplifier can filter out most of the background optical noise; (2) the length of the fiber can be much longer than that of traditional SBS medium, so a high gain can be realized by the pump with a much lower power. The experiment results demonstrated that the fiber Brillouin amplifier is suitable for the amplification of weak pulse signals. The Stokes peak power magnification and SNR of a fiber medium are studied.

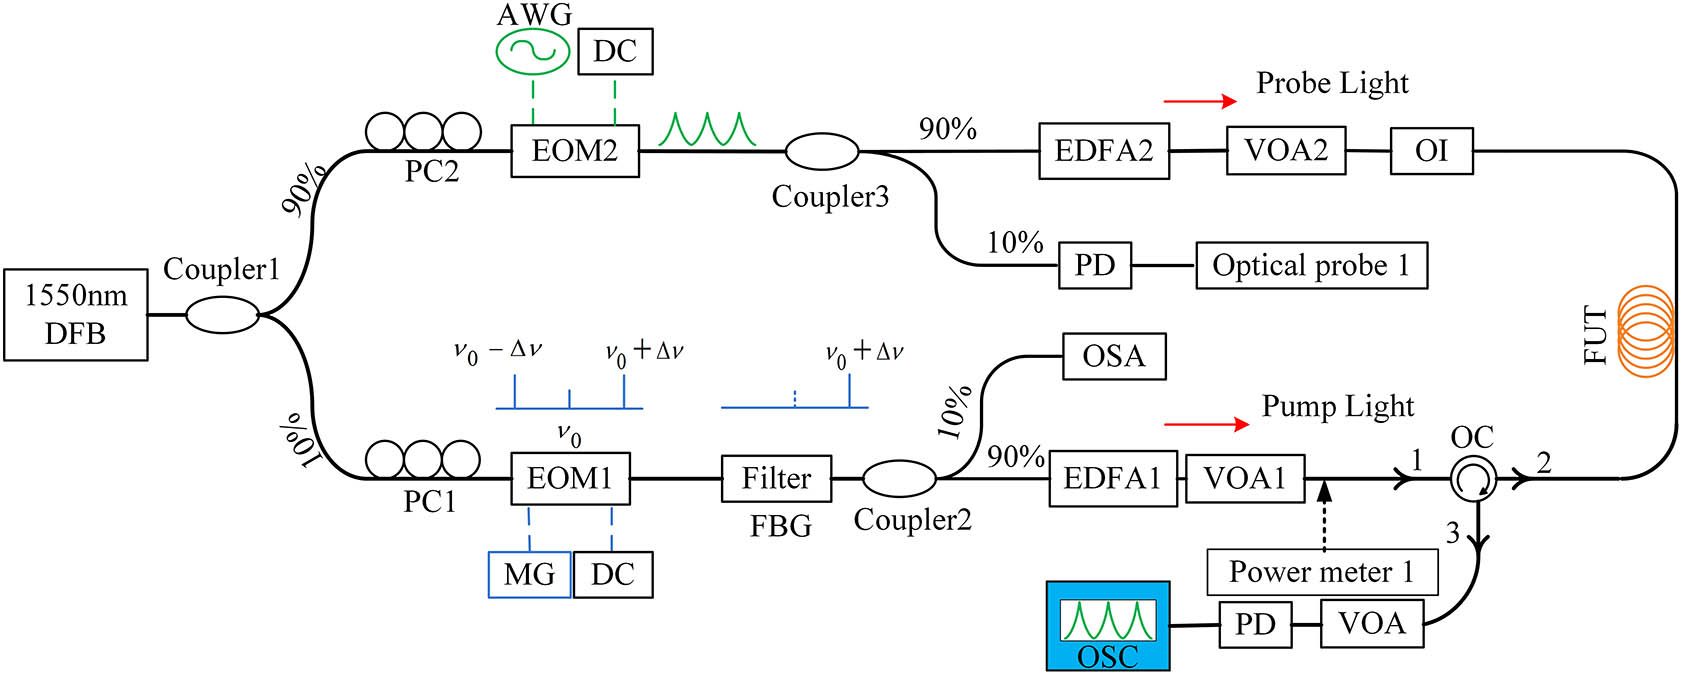
    The experimental optical path is shown in Fig. 1. A distributed feedback optical fiber laser with a 10 kHz ultra-narrow linewidth outputs a CW laser that operates at the wavelength of 1550 nm and outputs the power of 94.2 mW. Then, a 90/10 coupler is used to split the output CW into two branches. The upper branch is used for the generation of the Stokes light. It is modulated by an electro-optic modulator (EOM2) with a 45 dB high extinction ratio to form a 40 ns Gaussian pulse with a repetition rate of 50 kHz. Note that the Stokes pulse is 40 ns wide, which is used to match the intrinsic linewidth of the optical fiber. After passing through the EOM2, which is driven by an arbitrary waveform generator (AWG), the Stokes light is amplified by an erbium-doped fiber amplifier (EDFA2). The other branch is used as the pump light. It is offset in frequency with the Brillouin frequency shift (BFS) of 10.83GHz by an intensity modulator (EOM1), which works at the carrier suppression mode. The output of EOM1 is filtered by a fiber Bragg grating (FBG) to retain the upper sideband. When the pump component passes through the EOM1 and some optical devices, it is injected into SMF (Corning SMF-28e). The 40 ns Gaussian pulse Stokes light and the pump light meet in the amplifying medium. The peak power of the Stokes pulse, and also the pump light, can be controlled by means of variable optical attenuator (VOA2). The amplified Stokes light is captured by a photodetector (PD) and sampled by an oscilloscope.

    Schematic diagram of the experimental setup. EOM, electro-optic modulator; EDFA, erbium-doped fiber amplifier; FUT, fiber under test; PC, polarization controller; AWG, arbitrary waveform generator; OI, optical isolator; PD, photodetector; MG, microwave generator; FBG, fiber Bragg grating; VOA, variable optical attenuator; OSC, oscilloscope; OC, circulator.

    Figure 1.Schematic diagram of the experimental setup. EOM, electro-optic modulator; EDFA, erbium-doped fiber amplifier; FUT, fiber under test; PC, polarization controller; AWG, arbitrary waveform generator; OI, optical isolator; PD, photodetector; MG, microwave generator; FBG, fiber Bragg grating; VOA, variable optical attenuator; OSC, oscilloscope; OC, circulator.

    Power meter 1 is used to monitor the CW pump light power, and an optical spectrum analyzer (OSA) is used to monitor the frequency domain waveform of the pump light after being filtered by the FBG. An oscilloscope is used to monitor the amplified Stokes light’s waveform and its peak power after amplification. Optical probe 1 is used to monitor the waveform of the Gaussian Stokes light and record the peak power of the pulse light.

    The oscilloscope used in this experiment is DPO71254C from Tektronix. Power meter is EXFO of FPM-300. The optical spectrum analyzer is YOKOGAWA of AQ6370D and is used to monitor the amplitude of DC bias to obtain a stable waveform of the pump light.

    In the experiment, to measure the medium parameters’ effect on the fiber Brillouin amplification process, the Stokes and pump power in the fiber is fixed. The SBS medium parameters’ effect on the amplification process can be studied by means of replacing the fiber medium. The main parameters include the core diameter and length. The case for the power parameters is the same. The Stokes peak power is kept at 430 nW. The SNR and the Stokes peak power magnification of the SBS amplification are investigated by changing the pump power. Peak power magnification is defined as the ratio of the amplified Stokes peak power (Psout) to the incident Stokes peak power (Psin): εp=Psout/Psin. The SNR is the ratio of the emitted Stokes peak power (Psout) to the output noise power (Pn): SNR=Psout/Pn.

    In the fiber Brillouin amplification process, as we all know, the pump light interacts with the acoustic wave in the fiber. When the pump and the Stokes pulse light meet in the medium, the backscattered Stokes light interferes with the input pump light and generates an acoustic wave through the effect of electrostriction. The forward propagating acoustic wave acts as a Bragg grating, which scatters more pump light in the backward direction. In this way, the Brillouin amplification is realized. A CW is used as the pump light in order to make full use of the characteristics of optical fiber.

    The following experiment results show the relationship between the two kinds of fiber with different core diameters and the variation of the pump power. Figures 2 and 3 show that Stokes peak power magnification and the SNR as the pump power changes in two kinds of fiber core diameter, respectively.

    Stokes peak power magnification as the pump power changes in two kinds of fiber core diameter.

    Figure 2.Stokes peak power magnification as the pump power changes in two kinds of fiber core diameter.

    According to the traditional view, the SBS gain that the Stokes light got from the pump satisfies the equation G=gIL=4gLP/(πD2),where g is the Brillouin gain coefficient, I is the input pump power density, L is the effective interaction length, P represents the input pump power, and D is the core diameter of the SMF. The exponential gain coefficient G of the system scales inversely with the diameter. Therefore, as the diameter of the fiber decreases, the SBS gain becomes larger and the magnification improves. However, it can be seen from Fig. 2 that the magnification of the fiber core diameter of 6 μm is higher than another when the pump power is below 200 mW. The state will be changed as the pump power increases. The phenomenon is derived from fine core diameter’s low coupling efficiency. Figure 3 shows that the SNR decreases with the pump power increasing and the SNR of the black block is superior to the red block. So, to obtain a higher gain, the fiber core diameter of 9 μm can be considered as an ideal medium for SBS amplification. Figures 4 and 5, respectively, correspond to the signal magnification and the SNR curve under the conditions of different fiber lengths. By using different lengths of optical fiber, the magnification increases with the fiber length increasing, while the SNR decreases a lot. The longer the fiber, the higher the resulting gain when the pump power and the Stokes peak power remain unchanged. Therefore, as the gain increases, the peak power magnification of the Stokes and noise are increasing, so the SNR is decreasing. Meanwhile, we find that the amplified Stokes peak power increases with the pump light power increasing in the same length of fiber. From the results above, obviously, the magnification and the SNR of a 1 km long 9 μm fiber core diameter are higher than others. A maximum amplification up to 70 dB is achieved. A high signal gain is obtained when the pump power is above 200 mW. Once the value of the pump power exceeds 300 mW, the magnification remains approximately constant because of saturation. The gain factor gIL in this experiment is larger than 20, which is the threshold for the generation of the SBS process. This is mainly because of the competition between the generation process and the amplification of the leaked CW-Stokes of EOM2. The leaked CW wave of EOM2 is amplified by the CW pump, which generates an acoustic field because of the interference between the pump and the leaked wave. It suppresses the generation of the spontaneous acoustic field, which is the origin of the spontaneous SBS. Figures 3 and 5 show the influence of the pump power on SNR. It can be that SNR decreases with the pump power increasing, which may result from the amplification of the leakage of EOM2.

    SNR as the pump power changes in two kinds of fiber core diameter.

    Figure 3.SNR as the pump power changes in two kinds of fiber core diameter.

    Stokes peak power magnification as the pump light power changes in two kinds of fiber length.

    Figure 4.Stokes peak power magnification as the pump light power changes in two kinds of fiber length.

    SNR as the pump light power changes in two kinds of fiber length.

    Figure 5.SNR as the pump light power changes in two kinds of fiber length.

    Then, keeping the pump power at 300 mW, the optical fiber Brillouin amplification process is observed with the Stokes light peak power variation in SMF. Figure 6 shows the magnification of Stokes changes with the increase of the Stokes peak power. Its influence on the SNR is shown in Figure 7.

    Influence of the Stokes peak power on the Stokes magnification.

    Figure 6.Influence of the Stokes peak power on the Stokes magnification.

    Influence of the Stokes peak power on the Stokes SNR.

    Figure 7.Influence of the Stokes peak power on the Stokes SNR.

    From the above experiment results, it can be noted that the signal gain decreases with the Stokes peak power increasing. The SNR increases with the Stokes peak power increasing. This is because when it keeps the pump power and the medium’s length unchanged, the gain G that the Stokes pulse got from the CW pump is at a certain value. Therefore, as the Stokes peak power increases, the peak power magnification decreases and the SNR increases.

    The above experiment results show that the proposed amplification method that is based on SBS in optical fiber can be employed to achieve a high magnification. When selecting a Brillouin amplification medium, we should not only take the core diameter but also the length of the medium into consideration. The above results show that, for SMF-28 fiber, the best length of fiber used for SBS is 1 km long, and the amplification of the weak Stokes signal with the power is in the range of 101 to 1010W. Hence, the application scopes of weak signals with high gain are greatly expanded.

    Considering that there are no appropriate instruments in our lab to measure the spectra of signals, an analysis of the characteristics of the spectra is given to investigate this characteristic. The width of the Stokes pulse is 40 ns in the experiment, the bandwidth of which is estimated to be about 10 MHz (full width at half-maximum) according to a Fourier transform. It is much narrower than the Brillouin linewidth of the optical fiber (approx. 30 MHz). Therefore, all the frequency components lie in the amplification band, which can be amplified with almost the same gain. This suggests that there is no significant change in the shape of the spectrum of the amplified Stokes light. The width of the amplified Stokes is broadened to 60ns, which implies that the spectral width of the amplified light is decreased. We will study the spectrum characteristics of the Stokes beam before and after amplification based on a fiber Brillouin amplifier (FBA) in future.

    In conclusion, by the same CW pump power, the Stokes signal of a few hundred nanowatts is amplified based on FBA. Different power conditions and medium parameters are studied. The results show that with the increasing of the pump light power, the weak signal gain is increasing and the SNR is decreasing, and with the increasing of the Stokes light peak power, the weak signal gain is decreasing and the SNR is increasing. We have demonstrated a 70 dB amplification for a weak optical signal based on stimulated Brillouin scattering in optical fiber, which is 30 dB higher than the previous studies[21]. The proposed method has the advantages of a simple structure, convenient adjustment, and being easy to implement. This experiment proves that it is available to amplify a weak laser pulse by CW through the SBS method.

    References

    [1] Y. Glick, S. Sternklar. Opt. Lett., 17, 862(1992).

    [2] H. Shin, W. J. Qiu, R. Jarecki, J. A. Cox, R. H. Olsson, A. Starbuck, Z. Wang, P. T. Rakich. Nat. Commun., 4, 1944(2013).

    [3] W. Gao, Z. W. Lu, W. M. He, Y. K. Dong, W. L. J. Hasi. Laser Part. Beams, 27, 465(2009).

    [4] Y. Glick, S. Sternklar. J. Opt. Soc. Am. B, 12, 1074(1995).

    [5] Y. Chen, Z. W. Lu, Y. L. Wang, W. M. He. Opt. Lett., 39, 3047(2014).

    [6] W. Gao, D. Sun, Y. F. Bi, J. Y. Li, Y. L. Wang. Appl. Phys. B, 107, 355(2012).

    [7] Z. T. Huang, C. Yan, K. Wu, Y. F. Ji. Chin. Opt. Lett., 14, 102301(2016).

    [8] L. Walchshausl, R. Lindl, K. Vogel, T. Tatschke. Proc. Advanced Microsystems for Automotive Applications AMAA, 53(2006).

    [9] M. S. Darms, P. E. Rybski, C. Baker, C. Urmson. IEEE Transactions on Intelligent Transportation Systems, 475(2009).

    [10] D. C. Jones, A. M. Scott, I. Stewart. Opt. Lett., 20, 692(1995).

    [11] W. Gao, Z. W. Lu, W. M. He, C. Y. Zhu, Y. K. Dong. Acta Phys. Sin., 56, 2693(2007).

    [12] W. Gao, Z. W. Lu, Y. K. Dong, W. M. He. Chin. Opt. Lett., 4, 428(2006).

    [13] M. Nouri, M. Mivehchy, M. F. Sabahi. Chin. Opt. Lett., 15, 100302(2017).

    [14] Y. F. Zhang, Y. He, F. Yang, Y. Luo, W. B. Chen. Chin. Opt. Lett., 14, 111101(2016).

    [15] Z. J. Zhang, J. L. Zhang, L. Wu, Y. Zhang, Y. Zhao, J. Z. Su. Opt. Lett., 38, 4389(2013).

    [16] M. Hayman, S. Spuler. Opt. Express, 25, A1096(2017).

    [17] I. M. Bel’dyugin, V. F. Efimkov, S. I. Mikhailov, I. G. Zubarev. J. Russ. Laser Res., 26, 1(2005).

    [18] Z. Lu, W. Gao, W. He, Z. Zhang, W. Hasi. Opt. Express, 17, 10675(2009).

    [19] S. Sternklar, S. Jackel, D. Chomsky, A. Zigler. Opt. Lett., 15, 616(1990).

    [20] Y. Souidi, F. Taleb, J. Zheng, M. W. Lee, F. D. Burck, V. Roncin. Appl. Opt., 55, 248(2016).

    [21] L. Xing, L. Zhan, S. Y. Luo, Y. X. Xia. IEEE J. Quantum Electron., 44, 1133(2008).

    Liwen Sheng, Dexin Ba, Zhiwei Lü. Weak laser pulse signal amplification based on a fiber Brillouin amplifier[J]. Chinese Optics Letters, 2018, 16(11): 111901
    Download Citation