


Xiaocong Peng, Yuanan Zhao, Yueliang Wang, Zhen Cao, Guohang Hu, Jianda Shao. Variation of the band structure in DKDP crystal excited by intense sub-picosecond laser pulses[J]. High Power Laser Science and Engineering, 2018, 6(3): 03000e41
- High Power Laser Science and Engineering
- Vol. 6, Issue 3, 03000e41 (2018)
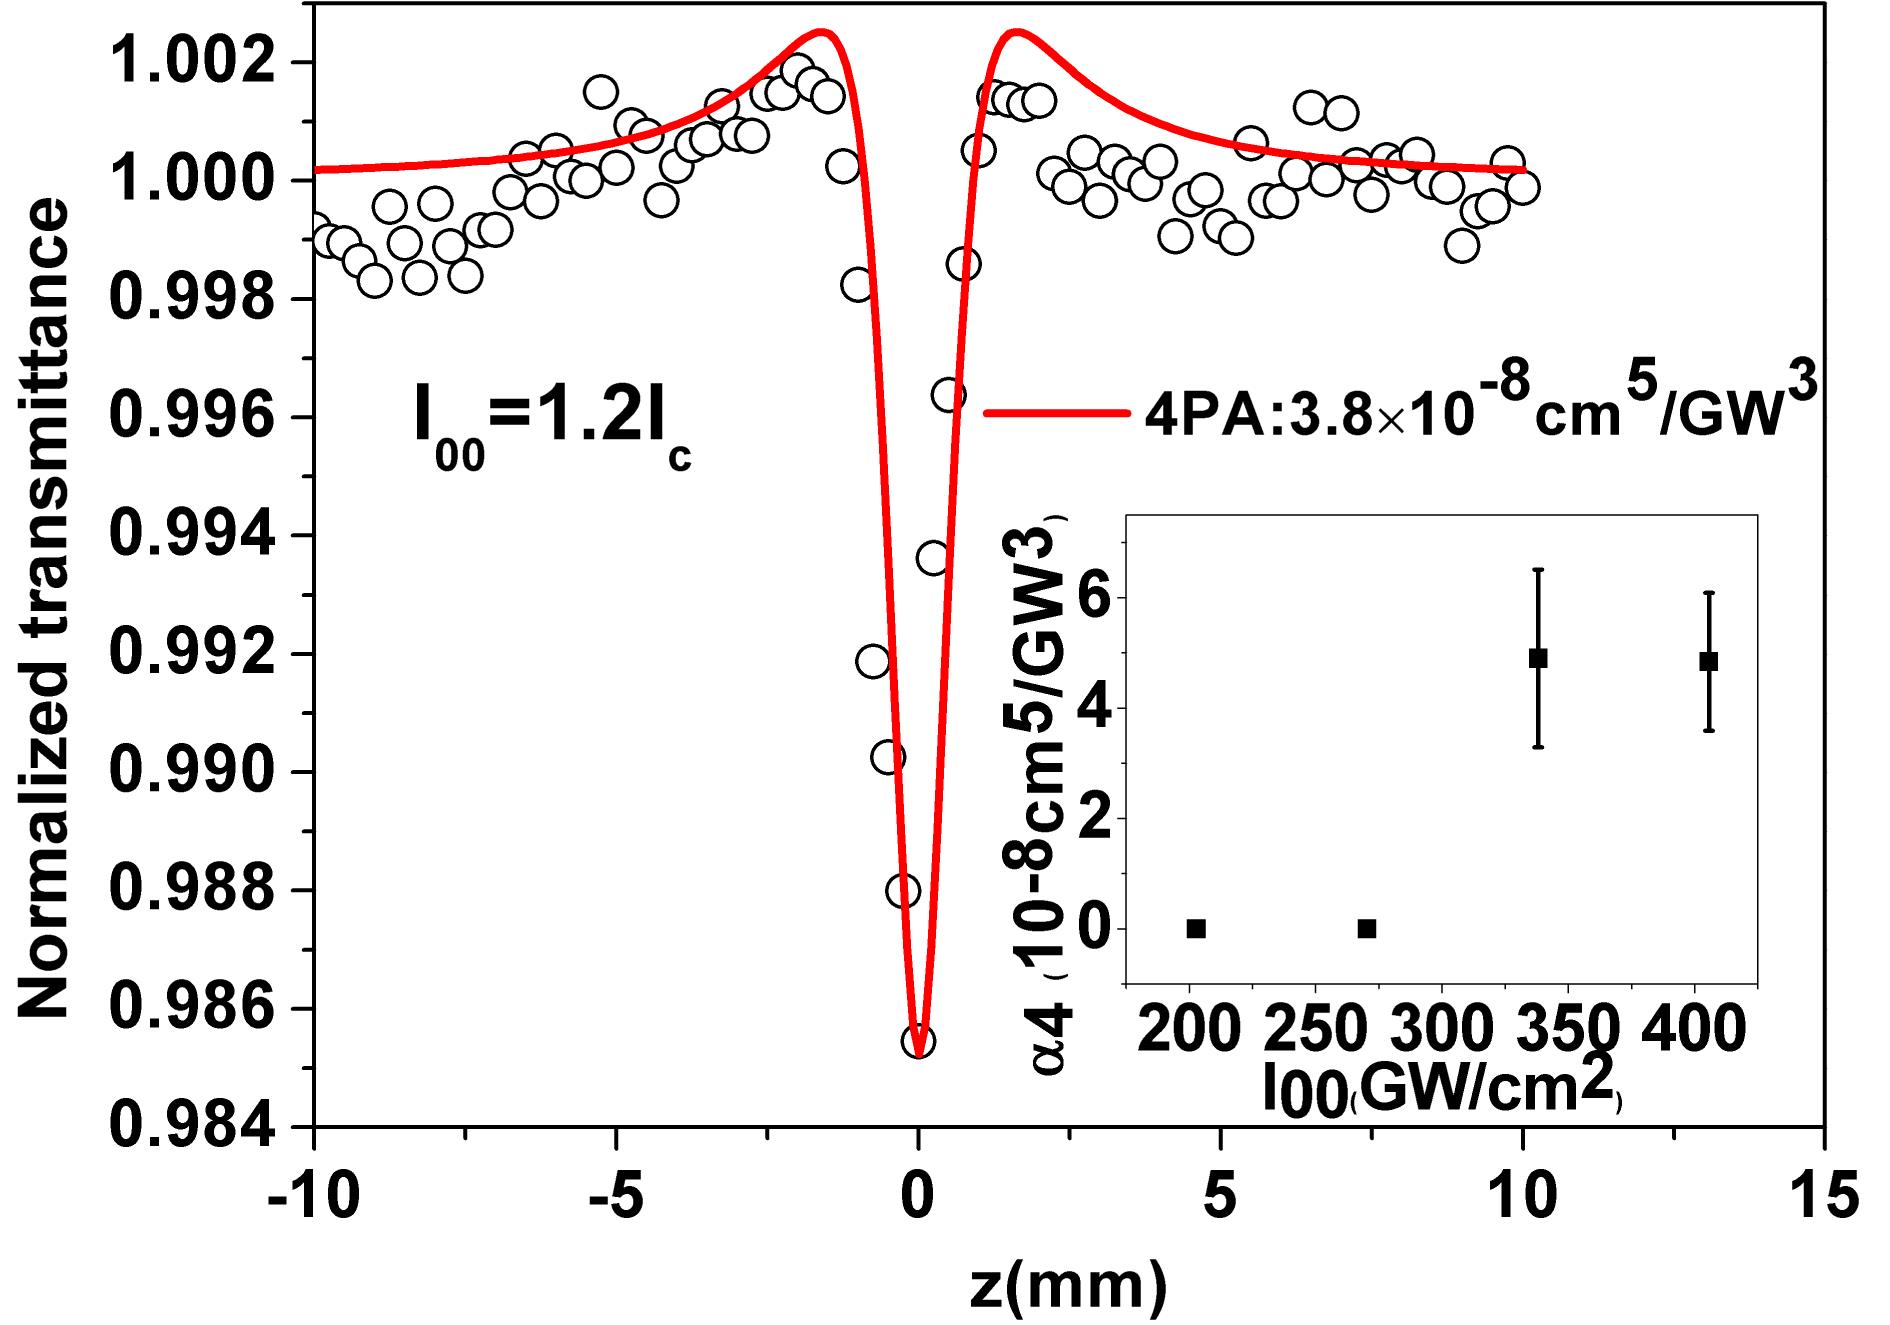
Fig. 1. Representative OA Z-scan trace for the DKDP crystal at an excitation intensity of  . The circular symbols represent the experimental data, while the solid line is the theoretical fitting result by the use of the 4PA theory. The inset is the 4PA coefficient of the DKDP crystal at different excitation laser intensities, while the error bars are the standard deviation from five Z-scan experiments.
. The circular symbols represent the experimental data, while the solid line is the theoretical fitting result by the use of the 4PA theory. The inset is the 4PA coefficient of the DKDP crystal at different excitation laser intensities, while the error bars are the standard deviation from five Z-scan experiments. 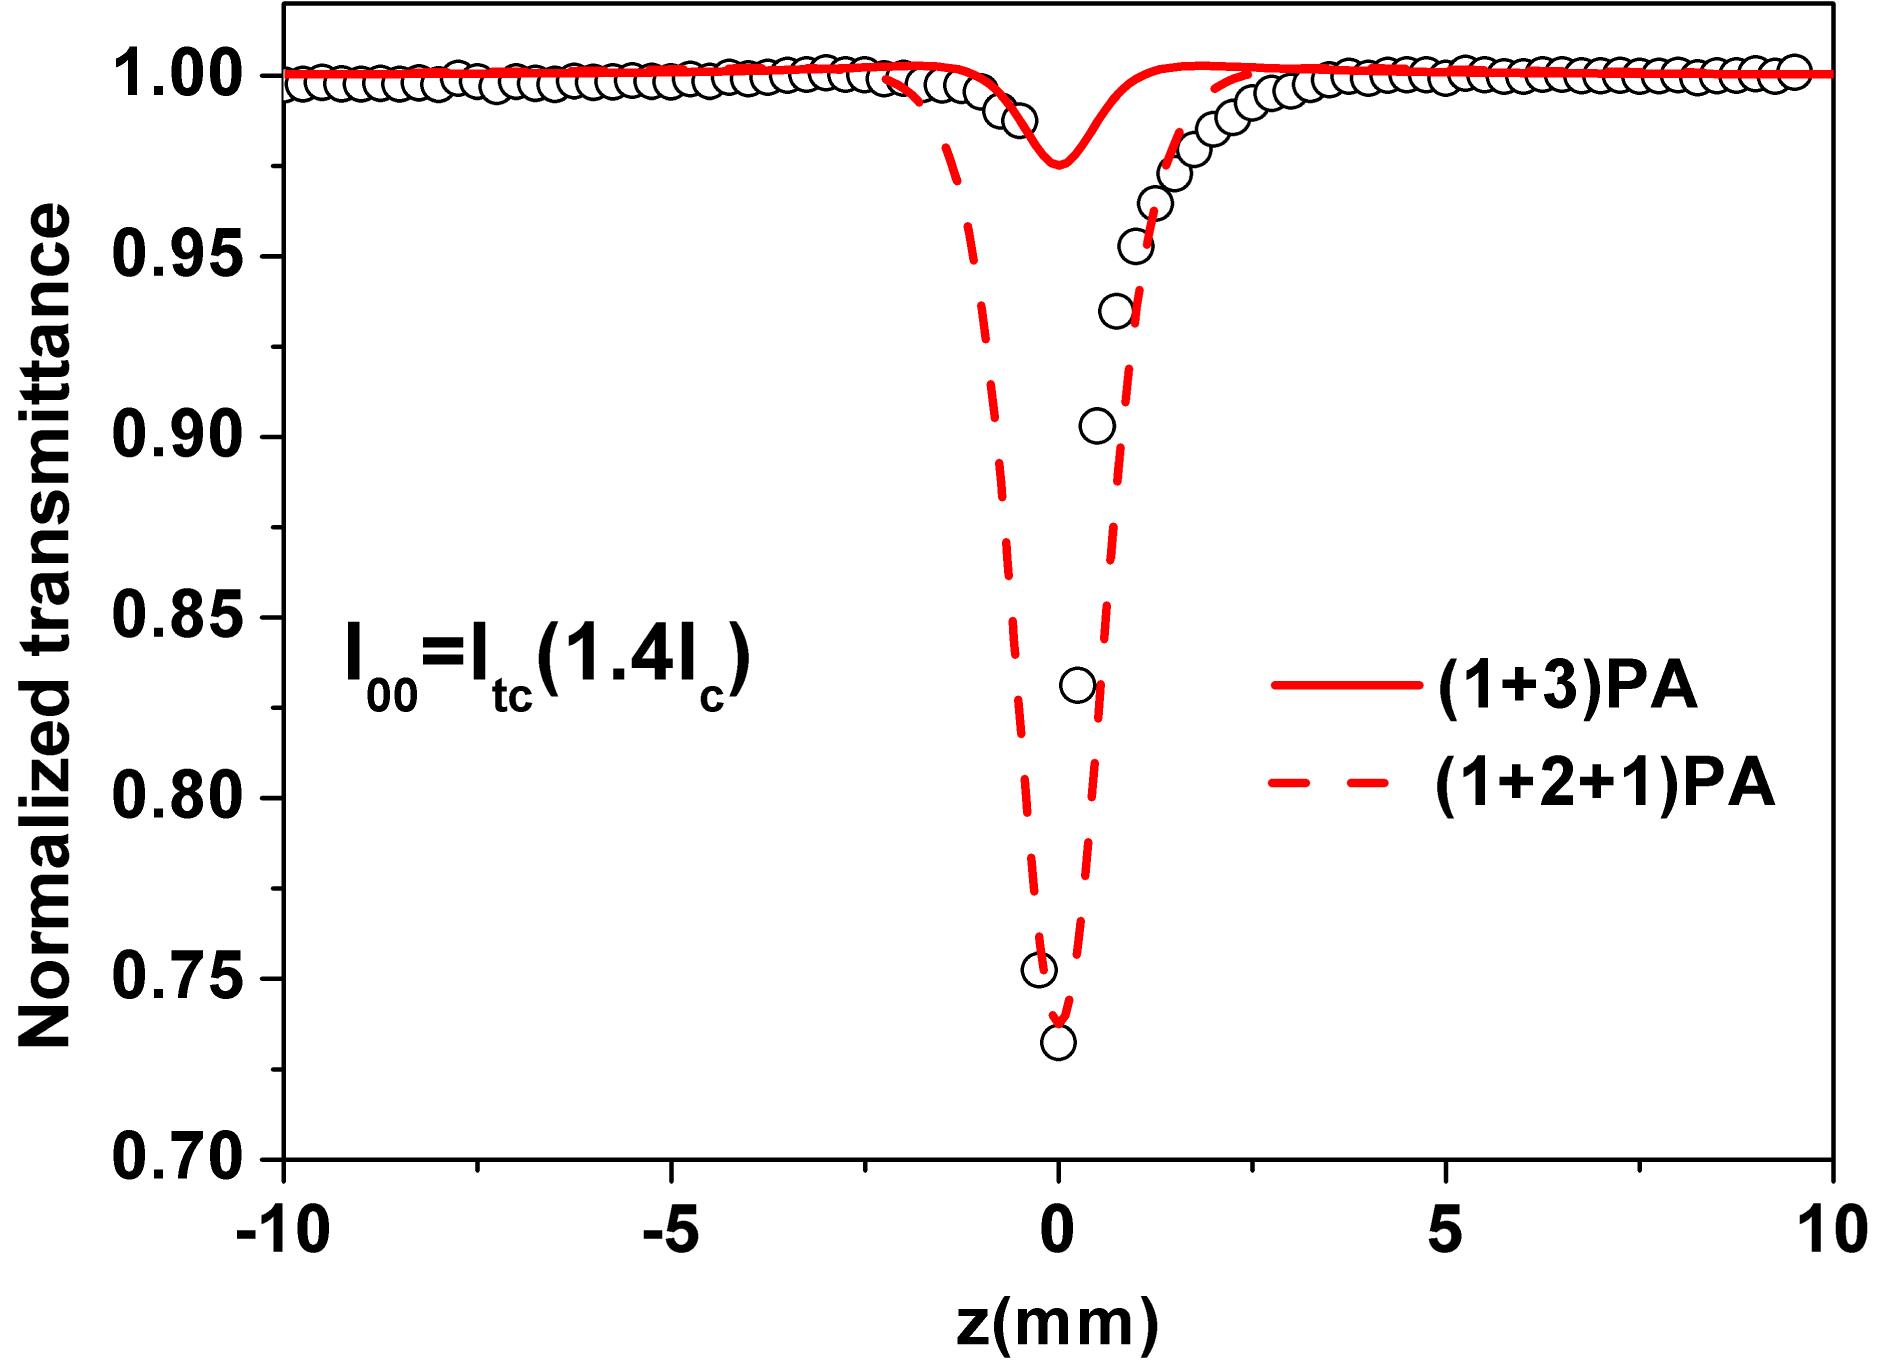
Fig. 2. Representative OA Z-scan trace for the DKDP crystal at the excitation intensity of  . The circular symbols are the experimental data, while the solid (dotted) line is the theoretical fitting result by the use of the (
 ) PA theory ((
 ) PA theory).
. The circular symbols are the experimental data, while the solid (dotted) line is the theoretical fitting result by the use of the () PA theory (() PA theory). Fig. 3. (a) The OA Z-scan traces for the DKDP crystal at the excitation intensity of  . Squares, circles and triangles are the experimental data before excitation with
  , after excitation with
  and about 10 min after excitation with
  , respectively. The solid (dotted) line is the theoretical fitting result using the (
 ) PA theory ((
 ) PA theory). (b) The OA Z-scan traces for the DKDP crystal at
  . Squares and circles are the experimental data before excitation with
  and after excitation with
  , respectively. The solid line is the theoretical fitting result obtained using the (
 ) PA theory.
. Squares, circles and triangles are the experimental data before excitation with , after excitation with and about 10 min after excitation with , respectively. The solid (dotted) line is the theoretical fitting result using the () PA theory (() PA theory). (b) The OA Z-scan traces for the DKDP crystal at . Squares and circles are the experimental data before excitation with and after excitation with , respectively. The solid line is the theoretical fitting result obtained using the () PA theory. Fig. 4. Schematic illustration of the band structure. The solid arrows indicate the absorption of photons, whereas the dash-dotted arrows indicate the relaxation process. S1 and S2 are the states located in the band gap.
|
Table 1. Value of the parameters used in the fitting.

Set citation alerts for the article
Please enter your email address
© Copyright 2018-2021 | Chinese Laser Press. All Rights Reserved 沪ICP备15018463号-20