• Chinese Journal of Lasers
  • Vol. 51, Issue 6, 0604003 (2024)
Zhengzhou Wang, Li Wang, Yaxuan Duan*, Gang Li, and Jitong Wei
Author Affiliations
  • Laboratory Advanced Optical Instrument, Xi’an Institute of Optics and Precision Mechanics, Chinese Academy of Science, Xi’an 710119, Shaanxi , China
  • show less
    DOI: 10.3788/CJL231185 Cite this Article Set citation alerts
    Zhengzhou Wang, Li Wang, Yaxuan Duan, Gang Li, Jitong Wei. NVPCA Image Enhancement‑Based Detection Method for Sidelobe Peak Parameters in Weak Signal Regions[J]. Chinese Journal of Lasers, 2024, 51(6): 0604003 Copy Citation Text show less
    Neighborhood information for each pixel in the image. (a) Access order; (b) the gray for each pixel
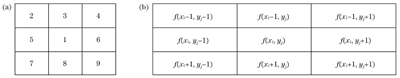
    Fig. 1. Neighborhood information for each pixel in the image. (a) Access order; (b) the gray for each pixel
    Flow chart of sidelobe weak signal peak parameter detection
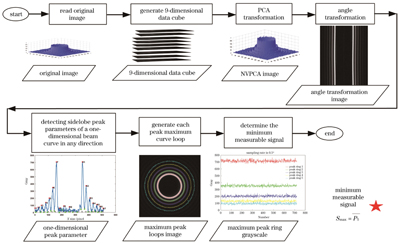
    Fig. 2. Flow chart of sidelobe weak signal peak parameter detection
    Building a multi-dimensional data cube. (a) Original sidelobe laser image; (b) multi-dimensional data cube
    Fig. 3. Building a multi-dimensional data cube. (a) Original sidelobe laser image; (b) multi-dimensional data cube
    NVPCA transformation results. (a) The first dimension image; (b) the second dimension image; (c) the third dimension image; (d) the fourth dimension image; (e) NVPCA transform eigenvalues
    Fig. 4. NVPCA transformation results. (a) The first dimension image; (b) the second dimension image; (c) the third dimension image; (d) the fourth dimension image; (e) NVPCA transform eigenvalues
    Image of angle transformation result
    Fig. 5. Image of angle transformation result
    Peak parameter detection results of NVPCA transform one-dimensional sidelobe curve (Y=256 pixel)
    Fig. 6. Peak parameter detection results of NVPCA transform one-dimensional sidelobe curve (Y=256 pixel)
    Maximum wave peak loops detection results
    Fig. 7. Maximum wave peak loops detection results
    Gray scale maximum curves of 5 maximum wave peak loops in each direction (after NVPCA transformation)
    Fig. 8. Gray scale maximum curves of 5 maximum wave peak loops in each direction (after NVPCA transformation)
    Original sidelobe images. (a) Two-dimensional image; (b) three-dimensional image
    Fig. 9. Original sidelobe images. (a) Two-dimensional image; (b) three-dimensional image
    NVPCA transformation sidelobe images. (a) Two-dimensional image; (b) three-dimensional image
    Fig. 10. NVPCA transformation sidelobe images. (a) Two-dimensional image; (b) three-dimensional image
    Comparison of peak signal before and after NVPCA transformation (Y=256 pixel)
    Fig. 11. Comparison of peak signal before and after NVPCA transformation (Y=256 pixel)
    Comparison of peak gray maximum in all directions (0°‒360°) of 5 peak loops before and after NVPCA transformation
    Fig. 12. Comparison of peak gray maximum in all directions (0°‒360°) of 5 peak loops before and after NVPCA transformation
    Comparison of peak loops with different sampling angle intervals. (a) Sampling interval is 0.5° and sampling points is 720; (b) sampling interval is 0.125° and sampling points is 2880
    Fig. 13. Comparison of peak loops with different sampling angle intervals. (a) Sampling interval is 0.5° and sampling points is 720; (b) sampling interval is 0.125° and sampling points is 2880
    Schematic diagrams of angle transformation (30° to 60°)
    Fig. 14. Schematic diagrams of angle transformation (30° to 60°)
    Display of one-dimensional sidelobe curve peak parameter detection results in 2D plane mode (30°)
    Fig. 15. Display of one-dimensional sidelobe curve peak parameter detection results in 2D plane mode (30°)
    Display of one-dimensional sidelobe curve peak parameter detection results in 1D curve mode (30°)
    Fig. 16. Display of one-dimensional sidelobe curve peak parameter detection results in 1D curve mode (30°)

    Sidelobe

    No.

    Peak

    No.

    Pos. X

    Peak

    value

    Rise/fall

    Pulse

    width

    Gray integration

    Peak

    No.

    Pos. X

    Peak

    value

    Rise/fall

    Pulse

    width

    Gray

    integration

    LeftRight
    17160705.4616/22389993.511354705.4612/17299627.3
    26133348.2314/12264662.012381372.2411/15264602.0
    35107198.1315/13282656.713410201.1315/12272647.7
    4481138.0915/12271705.114432129.0811/14251383.9
    534999.069/18271182.815462111.0717/825762.5
    Table 1. Peak parameter detection results of NVPCA transform one-dimensional sidelobe curve (Y=256 pixel)
    Peak ringThreshold
    Ring No.P¯ik=1k=2k=3k=4k=5
    46.378663.382480.394397.3925114.4023
    1715.3436OKOKOKOKOK
    2355.7512OKOKOKOKOK
    3204.6734OKOKOKOKOK
    4133.5523OKOKOKOKOK
    596.9533OKOKOKNONO
    676.4709OKOKNONONO
    Table 2. Minimum measurable signal selection

    Left or

    right

    Side

    lobe

    No.

    Peak

    No.

    Pos. X

    Peak gray

    value

    NVPCA peak gray valueRgrayMean Rgray

    Gray

    integration

    NVPCA

    gray

    integration

    RintMean Rint
    Left16160553.11705.461.27541.26007857.49993.51.27191.2524
    25133271.83348.231.28113672.84662.01.2693
    34107156.29198.131.26772118.12656.71.2543
    4382108.94138.091.26761373.01705.11.2419
    524977.0099.061.2865948.71182.81.2468
    Right111354543.42705.461.29827553.99627.31.2745
    212381290.45372.241.28163613.74602.01.2735
    313410162.31201.131.23922088.12647.71.2680
    414432121.49129.081.06251109.81383.91.2470
    51546282.87111.071.3403648762.51.1767
    Table 3. Enhancement of peak signal by NVPCA transformation (Y=256 pixel)
    TypePeak ringThresholdTISelect
    Before NVPCARing No.P¯ik=3k=4k=5
    63.837677.064690.2916
    1538.9406OKOKOK

    k=3

    TI =63.8376

    Ring No:4

    Smax=56.5307

    2259.9234OKOKOK
    3142.4719OKOKOK
    486.3778OKOKNO
    556.5307NONONO
    After NVPCARing No.P¯ik=3k=4k=5
    80.386997.392114.3986
    1715.3387OKOKOK

    k=3

    TI =80.38696

    Ring No:5

    Smax=96.9051

    2355.7494OKOKOK
    3204.6672OKOKOK
    4133.5457OKOKNO
    596.9051OKNONO
    Table 4. Minimum measurable signal selection results before and after NVPCA transformation

    Sidelobe

    No.

    Peak

    No.

    Peak

    mark

    Pos. X

    Left

    trough

    Right

    trough

    Peak

    value

    Rise/fall

    Pulse

    width

    Gray

    integral

    111p1353340369756.4913/17309657
    212p2383369394363.2414/12264911
    313p3407394422213.1413/16292690
    414p4433422450141.0911/18291597
    515p5458450471117.088/14221032
    Table 5. Conversion between 2D plane and one-dimensional curve peak parameter detection results (30°)
    Zhengzhou Wang, Li Wang, Yaxuan Duan, Gang Li, Jitong Wei. NVPCA Image Enhancement‑Based Detection Method for Sidelobe Peak Parameters in Weak Signal Regions[J]. Chinese Journal of Lasers, 2024, 51(6): 0604003
    Download Citation