• Chinese Optics Letters
  • Vol. 16, Issue 10, 103001 (2018)
Han Zhang1、2, Zhaohui Zhang2、3、*, Xiaoyan Zhao3, Xiaotong Zhang1, Tianyao Zhang3, Can Cao3, and Yang Yu3
Author Affiliations
  • 1School of Computer and Communication Engineering, University of Science and Technology Beijing, Beijing 100083, China
  • 2Beijing Engineering Research Center of Industrial Spectrum Imaging, Beijing 100083, China
  • 3School of Automation and Electrical Engineering, University of Science and Technology Beijing, Beijing 100083, China
  • show less
    DOI: 10.3788/COL201816.103001 Cite this Article Set citation alerts
    Han Zhang, Zhaohui Zhang, Xiaoyan Zhao, Xiaotong Zhang, Tianyao Zhang, Can Cao, Yang Yu. Qualitative and quantitative analysis of atmospheric methanol using a continuous-wave terahertz spectrometer[J]. Chinese Optics Letters, 2018, 16(10): 103001 Copy Citation Text show less
    Schematic diagram of THz-FDS system for gas detection.
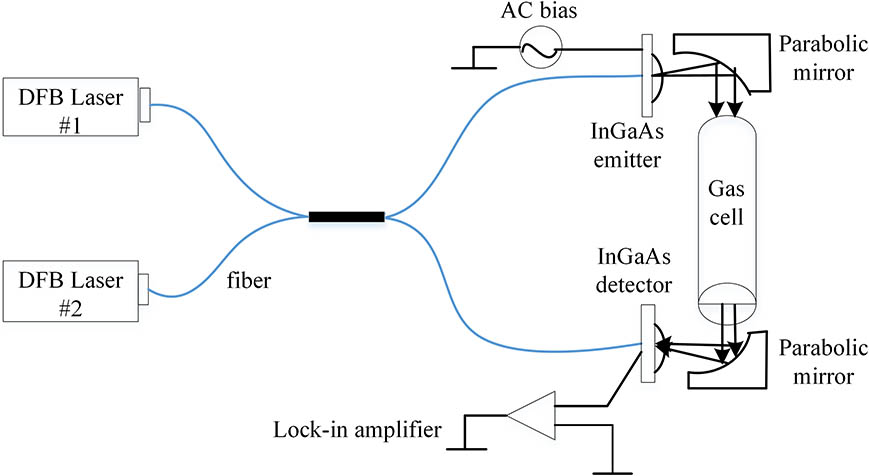
    Fig. 1. Schematic diagram of THz-FDS system for gas detection.
    Dynamic range of scanning THz signal of air (dashed line) and vacant gas cell (solid line).
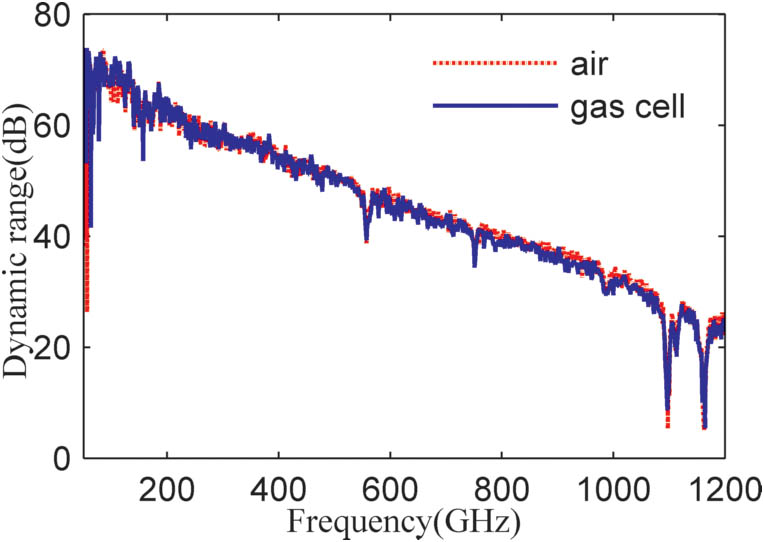
    Fig. 2. Dynamic range of scanning THz signal of air (dashed line) and vacant gas cell (solid line).
    Averaged amplitude of THz electric field signal of methanol sample (bottom) and reference (top).
    Fig. 3. Averaged amplitude of THz electric field signal of methanol sample (bottom) and reference (top).
    Calculated absorption cross section (bottom) from 100 to 1090 GHz compared with the experimental absorbance (top).
    Fig. 4. Calculated absorption cross section (bottom) from 100 to 1090 GHz compared with the experimental absorbance (top).
    The linear regression on the absorption peaks of methanol.
    Fig. 5. The linear regression on the absorption peaks of methanol.
    Three frequency sub-bands of absorbance spectra of nine samples with gradually reduced methanol vapor.
    Fig. 6. Three frequency sub-bands of absorbance spectra of nine samples with gradually reduced methanol vapor.
    Relative standard deviation (RSD) of THz signal for vacant chamber.
    Fig. 7. Relative standard deviation (RSD) of THz signal for vacant chamber.
    Sample No.Concentration (molecule/cm3)Adjusted R2 CoefficientRMSE
    12.348×10180.99260.09824
    22.061×10180.99390.07799
    31.793×10180.96780.15790
    41.488×10180.98910.07557
    51.245×10180.98590.07203
    67.186×10170.91650.10430
    78.854×10170.89430.14610
    84.283×10170.66420.14280
    93.922×10170.85040.07868
    Table 1. Linear Regression Results and Correctness of Fitting
    Han Zhang, Zhaohui Zhang, Xiaoyan Zhao, Xiaotong Zhang, Tianyao Zhang, Can Cao, Yang Yu. Qualitative and quantitative analysis of atmospheric methanol using a continuous-wave terahertz spectrometer[J]. Chinese Optics Letters, 2018, 16(10): 103001
    Download Citation