
Bo LI, Xiangyan YUAN, Zhengyang LI, Haiping LU. Active Alignment Method of Telescope Based on Star Ellipticity of Multi Field of View[J]. Acta Photonica Sinica, 2021, 50(4): 218
- Acta Photonica Sinica
- Vol. 50, Issue 4, 218 (2021)
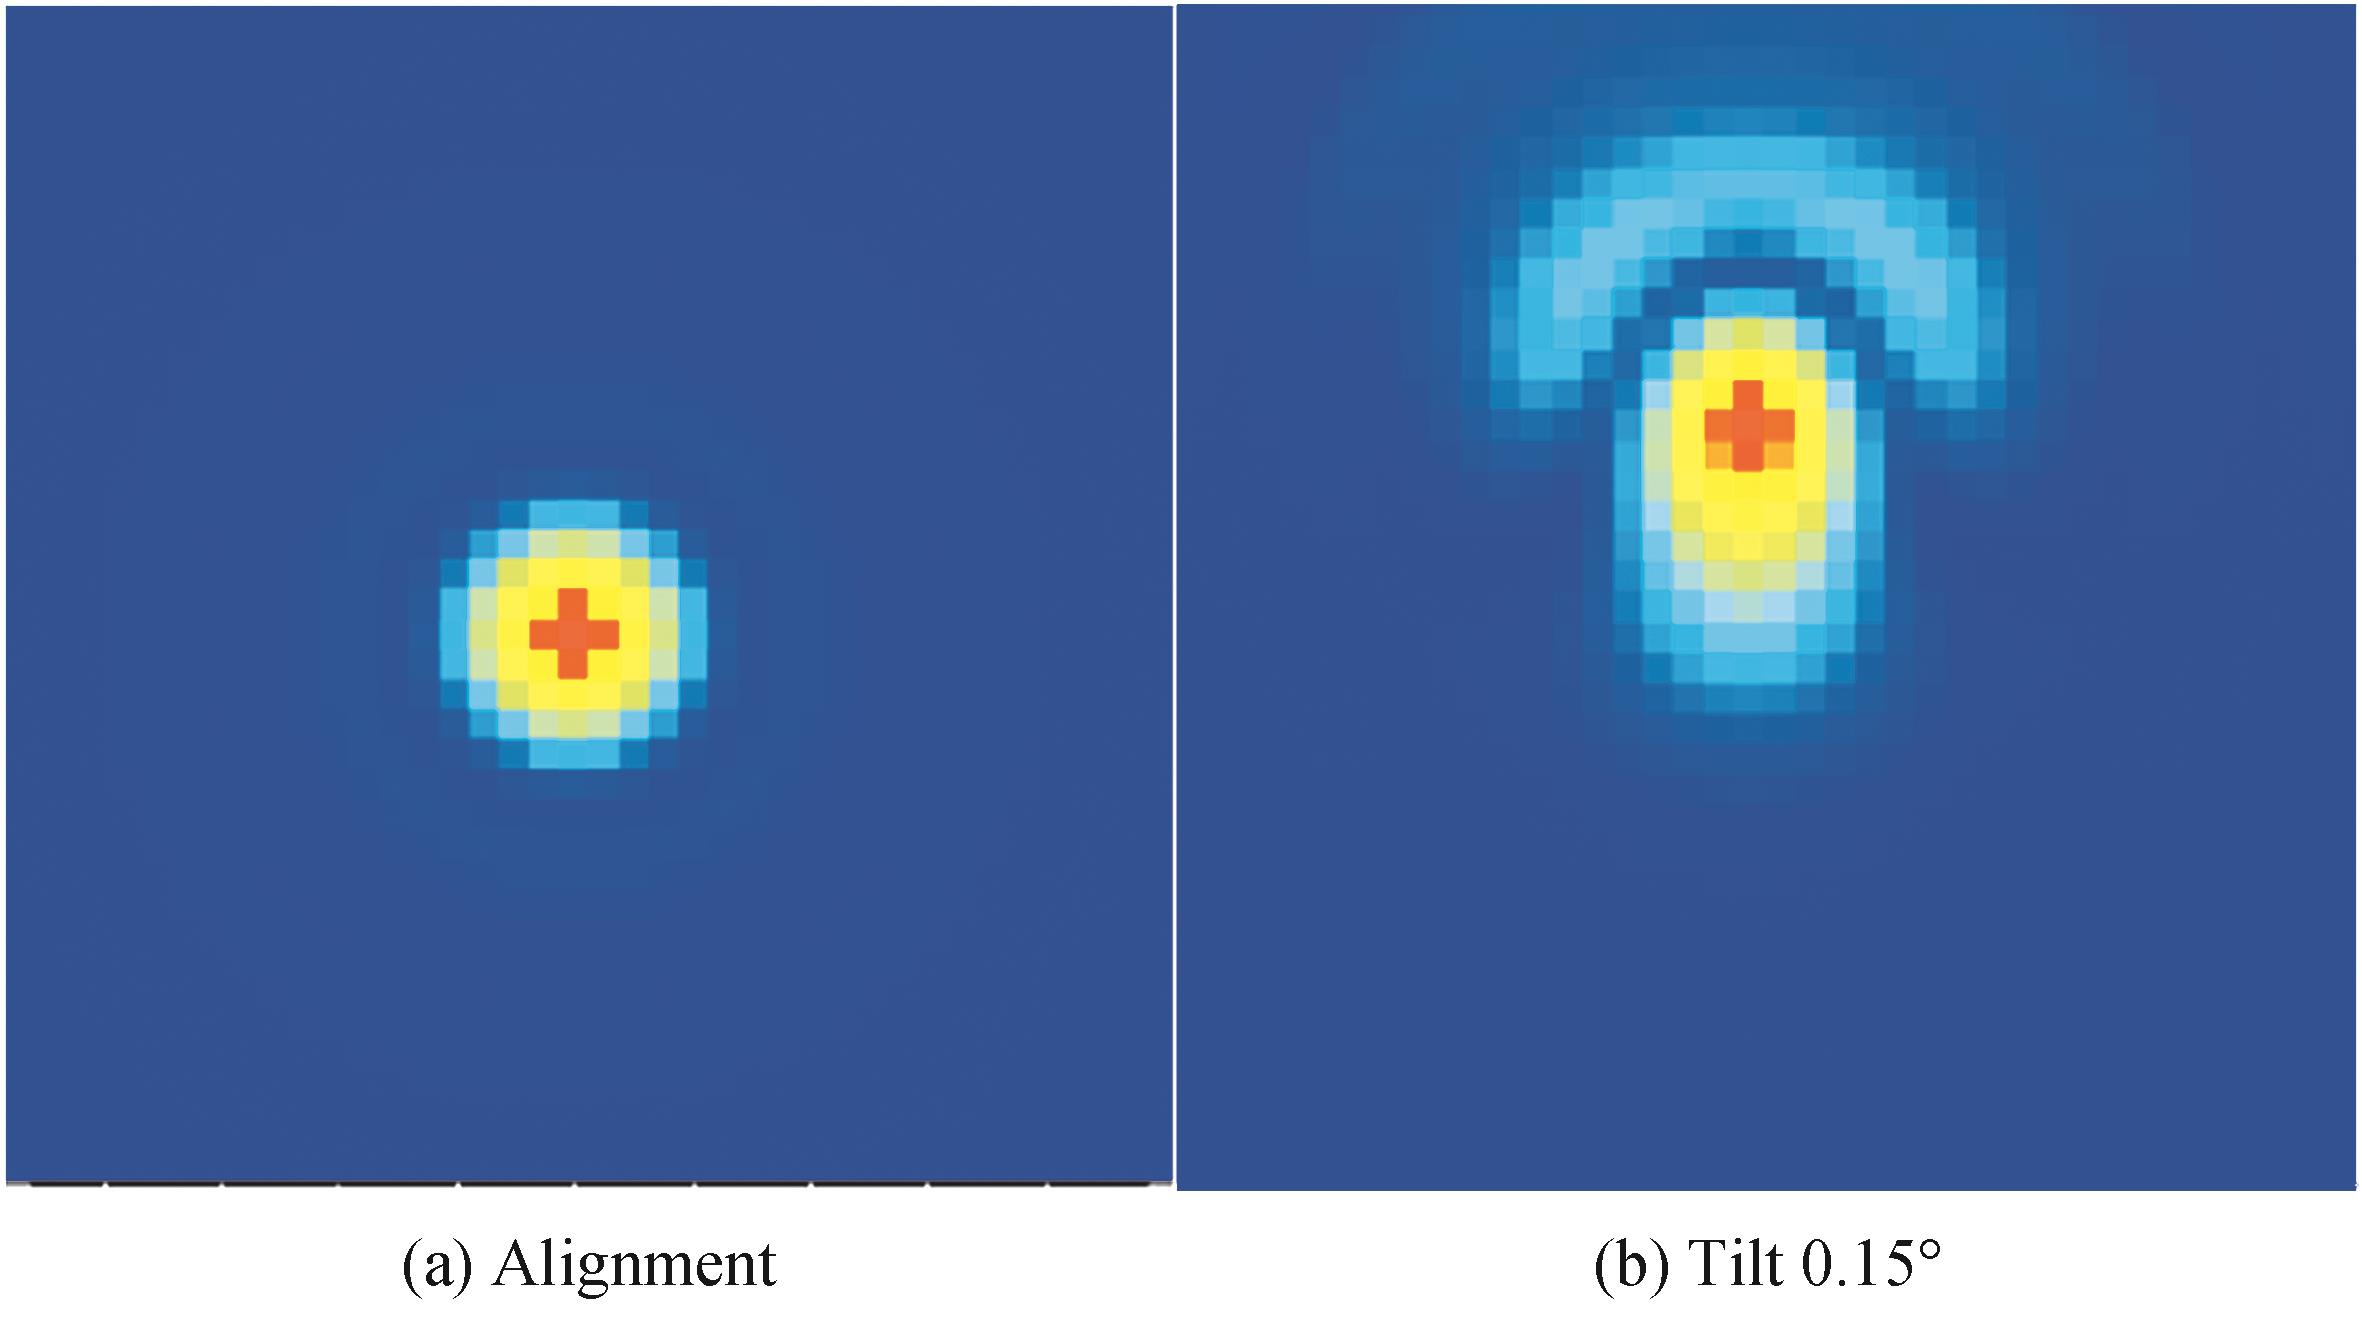
Fig. 1. Schematic diagram of PSF in collimated state and misalignment state
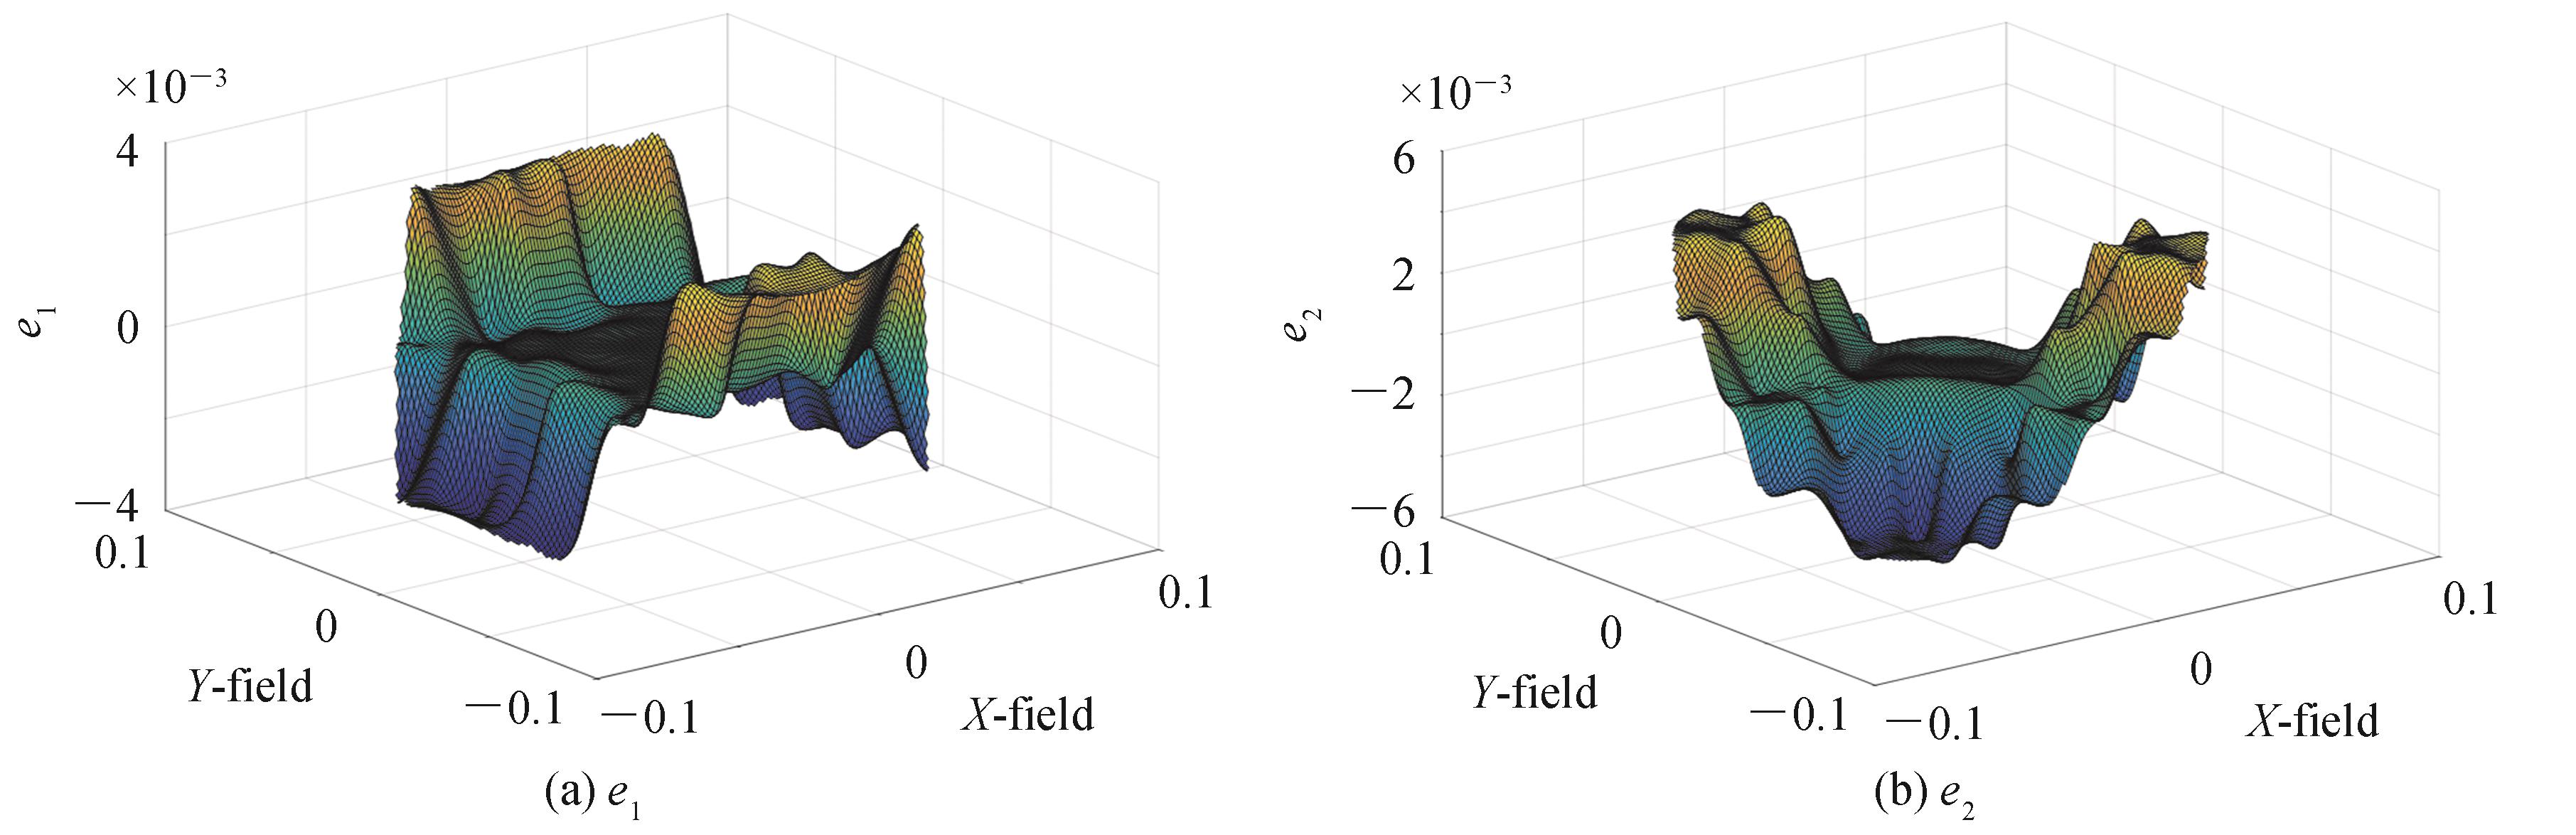
Fig. 2. Distribution of ellipticity e 1 ![]()
![]()
e 2 ![]()
![]()
Fig. 3. PSF morphology in each field of view
Fig. 4. Convergence process curve of particle swarm optimization algorithm
Fig. 5. Monte Carlo analysis algorithm solution accuracy chart (Note: red dotted line represents tolerance range)
Fig. 6. Data distribution diagram of 100 operation results (note: green represents the reference value, red represents the tolerance range)
Fig. 7. AST3-3 Optical system light path diagram
Fig. 8. Photograph of AST3-3 telescope and star map
Fig. 9. Schematic diagram of position of the target star points in field of view
Fig. 10. The contrast map of star in misalignment state and realignment state in paraxial field
Fig. 11. The contrast map of star in misalignment state and realignment state in edge field
Fig. 12. RMS radius distribution vs field of view in design state, misalignment state and realignment state
Fig. 13. Encircled energy distribution diagram of full field
|
Table 1. Telescope system parameter table
|
Table 2. Decenter and tilt tolerance of secondary mirror
|
Table 3. The ellipticity value of target and its solution in each field of view
|
Table 4. Range of secondary mirror misalignment
|
Table 5. Comparison of preset value and solution value

Set citation alerts for the article
Please enter your email address
© Copyright 2018-2021 | Chinese Laser Press. All Rights Reserved 沪ICP备15018463号-20