In this Letter, a refractive index measurement of a dielectric sample using highly focused radially polarized light is reported. Through imaging analysis of the optical field at the pupil plane of a high numerical aperture (NA) objective lens reflected by the sample under study, the Brewster angle is found. Employing a high NA objective lens allows the measurement of multiple angles of incidence from 0° to 64° in a single shot. The refractive index of the sample is estimated using the measured Brewster angle. The experimental results are compared with the theoretical images computed with the Fresnel theory, and a good agreement is obtained.
The refractive index is an essential optical parameter for the characterization of micro-structures. Several optical techniques used to measure the refractive indexes of thin films and dielectric materials have been developed through analyzing the light transmitted and reflected by the sample. The ellipsometric methods measure the change of polarization of the reflected or transmitted light by a surface[1,2], but the typical spatial resolution is poor, and the spot size is around millimeters or hundreds of micrometers. Therefore, several approaches have been developed to increase the spatial resolution of conventional ellipsometers[3–5]. There are some experimental methods for determining the refractive indexes of dielectric surfaces by using the polarization of light reflected near the Brewster angle of the sample under study[6,7], but the precision is not good enough. The polarized reflectance measurement technique for thickness and index (the PRETTI method) allows one to obtain the refractive index and thickness of a thin film by using S-polarized (linear polarization perpendicular to the plane of incidence) and P-polarized (linear polarization parallel to the plane of incidence) reflectance measured at oblique angles of incidence[8]. The prism coupling method is only applicable to thin samples[9]. The Abbe refractometer is based on the critical angle method; therefore, it is not applicable to samples with refractive indexes larger than its coupling prism[10]. The minimum deviation method is typically used for bulk materials, but the samples have to be prepared as prism shaped, which complicates the measurement[11]. Another method combines an optical low-coherence interferometer and confocal optics to make simultaneous measurements of the phase index, the group index, and the geometrical thickness of an optically transparent object[12–14], but it is very sensitive to the optical path difference and requires complex instrumentation. Most of those methods need a lot of time to make measurements; furthermore, the experiment arrangements are sophisticated, and the beam spot size is large and lacks spatial resolution.
In this work, a method to measure the refractive index by determining the Brewster angle is proposed. This method uses a polarimetric instrument that measures the intensity of the reflected light by the sample at the back focal plane for incidence angles ranging from 0° to 64° and all azimuths around a full circle when the sample is illuminated by highly focused radial polarization. A linear polarization state also was used with the aim of comparing it with the radial polarization result. A high numerical aperture (NA) microscope objective lens is used to illuminate the sample, with its back focal plane imaged on a CMOS camera. The objective lens allows high angles of illumination and produces a smaller beam spot size of around 0.8 μm on the sample. The tested dielectric sample was BK7 glass. The incident angle where the reflected intensity is at a minimum, namely, the Brewster angle, is found, and then the refractive index is estimated. The experimental and theoretical results are compared to validate the method.
Using Maxwell’s equations, the light behavior can be described through Fresnel’s equations when it is reflected and transmitted at the boundary between two different homogenous optically isotropic media[15]. When P-polarized light is incident upon a flat surface between two transparent dielectric media, the reflected electric field entirely disappears at a particular incident angle called the Brewster angle, and the incident beam is totally refracted into the second medium. Using Snell’s law, the Brewster angle can be determined when the parallel reflection amplitude is zero and the incident and transmitted angles sum to 90°, where and are the refractive indexes of the two media.
Sign up for Chinese Optics Letters TOC. Get the latest issue of Chinese Optics Letters delivered right to you!Sign up now
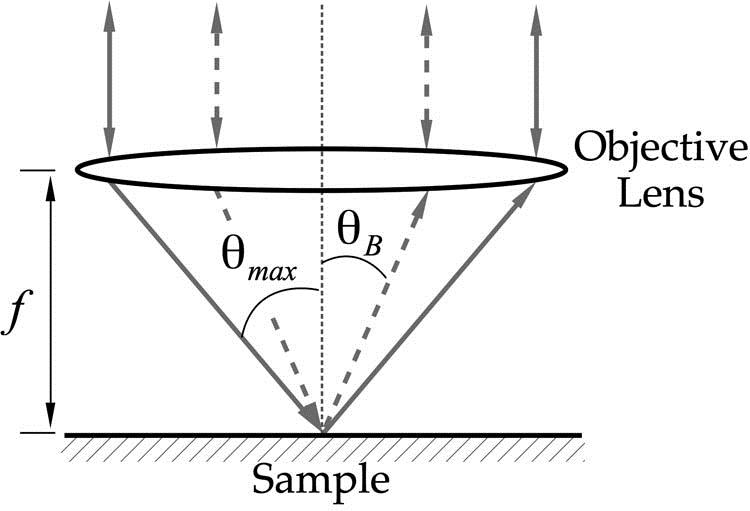
When a high NA lens obeying the sine condition focuses the incident light into a small spot on the sample’s surface (Fig. 1), the maximum angle of incidence () is calculated through the following equation,
Figure 1.Side view of a collimated illumination field focused into a sample.
The focal length of the lens is calculated by [15], where is the maximum radius of the exit pupil; thus, if the NA of the objective lens increases, the corresponding focal length is reduced. A high NA objective lens allows us to measure the data with better sensitivity because there is no Fresnel contribution at the Brewster angle from the sample, meaning the Fresnel coefficients at this angle are zero[16,17].
A radially polarized beam has the distribution of a spatially inhomogeneous electric field that has its polarization aligned radially[18].
The behavior of the polarized illumination field coming into an objective lens is illustrated in Fig. 2. Here, the angle between the incident electric field and the vector associated with the local plane of incidence has a geometrical dependence on the azimuthal position . This effect is shown in Fig. 2, where an incident radially polarized beam is always in the plane of incidence and hence is seen as linear -polarization for any azimuthal angle. Therefore, the reflected intensity distribution decreases to zero at the Brewster angle associated with the dielectric surface under study.
Figure 2.Radial polarization state of light focused by an objective lens. For any azimuthal angle (), the electric field is always in the plane of incidence.
To produce theoretical images of the beam reflected by the sample, matrices for the incident electric field distribution at the horizontal and vertical orientations were defined. Due to the fact that the incident field is focused onto the surface of the sample, it was projected in the plane of incidence to calculate its parallel (or ) component as follows, where is the radius vector associated with the azimuthal angle . On the other hand, the perpendicular (or ) contribution is realized according to the following equation,
Once the field components [Eqs. (3a) and (3b)] have been obtained, the reflected beam can be found via the Fresnel coefficients, and , by the following equations[15]:
Figure 3 shows the theoretical reflectance images generated numerically for the BK7 glass when it is illuminated with x-linear and radial polarization. In the simulation, a uniform light source and a homogeneous sample were considered. After obtaining these images, the position of the Brewster angle was found and compared with the experimental values. To extract the Brewster angle for each image, the pixel position where the intensity is minimum was identified. Then, the distance between the center of the image and the position was calculated through , and finally, the Brewster angle was obtained by means of , where is defined through the radius of the image as . This value allows the calculation of the Brewster angle and hence the refractive index of the sample.
The experimental setup is illustrated in Fig. 4. A beam generated by an unpolarized laser (Melles Griot, Model 05-LGR-193-381 @543.5 nm) is spatially filtered (Newport, Model 910A) and collimated by a lens (L1). It passes through a polarization-state generator (PSG) and ends up focused by the objective lens, OL, (Nikon, Tu Plan Fluor EPI P 0.9) onto the sample. After reflection from the sample, the light is recollected by the objective lens and steered to the camera by the non-polarizing beam splitter. A CMOS camera (Thorlabs, DCC3240C) is used to capture the images by using a second lens (L2). The sensor size is , and the pixel size is 5.3 μm (square). Taking into account the incident wavelength and the NA, the beam size at the focus is estimated to be approximately 0.8 μm[15].
Figure 4.Schematic diagram for the polarimetric experimental setup.
The PSG is employed to excite the sample with -polarization, which was generated by placing a linear polarizer (LP) of the Glan–Thompson type (Thorlabs, GTH10M), without the s-wave plate (SWP) present. To generate the radial polarization modes, a linear to radial/azimuthal polarization converter (Altechna, SWP, model RCP-515-06) has been employed[19,20]. This commercial device is a femtosecond laser machined nanostructure that spatially varies the phase to produce radial and azimuthal distributions of the electric field as well as the polarization vortex[21]. To facilitate alignment, each sample was assembled on an micrometric translational stage.
Figure 5 shows the experimental intensity distributions on the exit pupil plane of the objective lens when the sample is illuminated by x-linear [Fig. 5(a)] and radial [Fig. 5(b)] polarization, respectively. We can see that when the sample is illuminated with -polarized light, after reflection, axially symmetrical dark zones appear at specific positions where the intensity takes the minimum value. Due to the fact that the electric field direction of the radially polarized light is parallel to the incident local plane at each azimuthal angle of the objective lens, a dark ring could be observed. By the nature of the SWP, a minimum is always present at the center of the images registered by the CMOS camera.
The same digital procedure used to find the Brewster angle to the theoretical images was applied to process the experimental images. It is important to mention that the images present a little noise, and this could generate several minimum values; therefore, the average of those values was calculated.
Figure 5.Experimental intensity distributions on the exit pupil plane of the objective lens when the sample is illuminated by: (a) x-linear and (b) radial polarization. Symmetrical dark zones, highlighted by the dashed lines, appear as a consequence of light reaching the Brewster angle.
For the Brewster angle, the experimental result (Fig. 5, Table 1) was compared with the reported angle given by the refractive index of the BK7 glass[22]. According to Table 1, when the incident beam is radially polarized, the results are closer to the reported value and have a smaller error than the radially polarized results. The advantage of using radially polarized light is that this kind of illumination contains all linear polarizations, depending on the azimuthal angle, and it could be applied to test the anisotropy of a sample in a single measurement. The difference between the experimental and simulated results may be due to the fact that the experimental results are measured from a micro-metric region within the focus, which is assumed to be homogeneous and isotropic, while the reported reference value is the average value obtained using a well-manufactured sample and larger illuminating areas of several square mm.
Incident polarization
Parameter
Reported value
Theoretical value
x-polarized
Radially polarized
θB
56.650
56.590
56.349±1.279
56.116±1.502
n
1.519
1.516
1.504±0.071
1.492±0.082
Table 1. Measurement Results of the Brewster Angle and the Refractive Index of a Sample by Polarimetry
In conclusion, we have demonstrated an imaging polarimeter that measures the refractive index of a BK7 glass in a single shot. Although the sample is illuminated with two different polarization states, the refractive index is closer to the reported value when the incident beam is radially polarized. Probably, the small error presented between the experimental and the reported values originated from the fact that the experimental results have been obtained from illuminated regions at the micro-scale region, while the reported value considers larger areas around several square mm. The technique reported in this work allows ellipsometric measurements within the focal region, which may find applications in the micro-electronic industry. With this method and our numerical model, this technique can be used to generate high-spatial-resolution refractive index maps when the samples under study are non-homogeneous and non-isotropic.
References
[1] R. M. A. Azzam, N. M. Bashara. Ellipsometry and Polarized Light(1992).
[2] T. E. Jenkins. J. Phys. D, 32, R45(1999).
[3] C. W. See, M. G. Somekh, R. D. Holmes. Appl. Opt., 35, 6663(1996).
[4] Q. Zhan, J. R. Leger. Appl. Opt., 41, 4443(2002).
[5] S. Ye, S. H. Kim, Y. K. Kwak, H. M. Cho, Y. J. Cho, W. Chegal. Opt. Express, 15, 18056(2007).
[6] Q. H. Wu, I. Hodgkinson. J. Opt. Soc. Am. A, 10, 2072(1993).
[7] C. Bahrim, W.-T. Hsu. Am. J. Phys, 77, 337(2009).
[8] T. Kihara, K. Yokomori. Appl. Opt., 31, 4482(1992).
[9] R. Ulrich, R. Torge. Appl. Opt., 12, 2901(1973).
[10] S. Singh. Phys. Scr., 65, 167(2002).
[11] A. J. Werner. Appl. Opt., 7, 837(1968).
[12] S. Kim, J. Na, M. J. Kim, B. H. Lee. Opt. Express, 16, 5516(2008).
[13] S. C. Zilio. Opt. Express, 22, 27392(2014).
[14] Y. Kim, K. Hibino, N. Sugita, M. Mitsuishi. Opt. Express, 23, 4065(2015).
[15] M. Born, E. Wolf. Principles of Optics(1999).
[16] H. K. Pak, B. M. Law. Rev. Sci. Instrum., 66, 4972(1995).
[17] G. Jin, R. Jansson, H. Arwin. Rev. Sci. Instrum., 67, 2930(1996).
[18] Q. Zhan. Vectorial Optical Fields: Fundamentals and Applications(2014).
[19] . S-waveplate, linear to radial polarization converter(2013).
[20] 20As a matter of fact, an experimental evaluation revealed that it is necessary to rotate an angle of 45° between the alignment mark and the incident linear polarization to obtain the right mode. We have tested this for the model RCP-515-06 (two S-waveplates).
[21] M. Beresna, M. Gecevicius, P. Kazansky, T. Gertus. Appl. Phys. Lett., 98, 201101(2011).