• Photonics Research
  • Vol. 8, Issue 9, B1 (2020)
Xiang Xi, Kang-Ping Ye, and Rui-Xin Wu*
Author Affiliations
  • School of Electronic Science and Engineering, Nanjing University, Nanjing 200023, China
  • show less
    DOI: 10.1364/PRJ.396872 Cite this Article Set citation alerts
    Xiang Xi, Kang-Ping Ye, Rui-Xin Wu. Topological photonic crystal of large valley Chern numbers[J]. Photonics Research, 2020, 8(9): B1 Copy Citation Text show less
    (a) Schematic of 2D PC structure, composed of hexamers of six ferrite rods and embedded in the air background. The white lines denote the edge of a unit cell. (b) Band structure of the PC at R=a/3. A Dirac point is away from the high symmetry points in the first Brillouin zone. (c) 3D band structure of the PC. Three pairs of Dirac points are between the two bands in the Brillouin zone. (d) 3D band structure of Ref. [13]. One pair of Dirac points presents at the Γ point.
    Fig. 1. (a) Schematic of 2D PC structure, composed of hexamers of six ferrite rods and embedded in the air background. The white lines denote the edge of a unit cell. (b) Band structure of the PC at R=a/3. A Dirac point is away from the high symmetry points in the first Brillouin zone. (c) 3D band structure of the PC. Three pairs of Dirac points are between the two bands in the Brillouin zone. (d) 3D band structure of Ref. [13]. One pair of Dirac points presents at the Γ point.
    (a) Band structures of the PC at R1=a/3 and R2=a/2.26. (b) Berry curvature in the first Brillouin zone. Curvature is opposite around the K and K′ points, and the valley Chern number Cv=Ck−Ck′=1−(−1)=2.
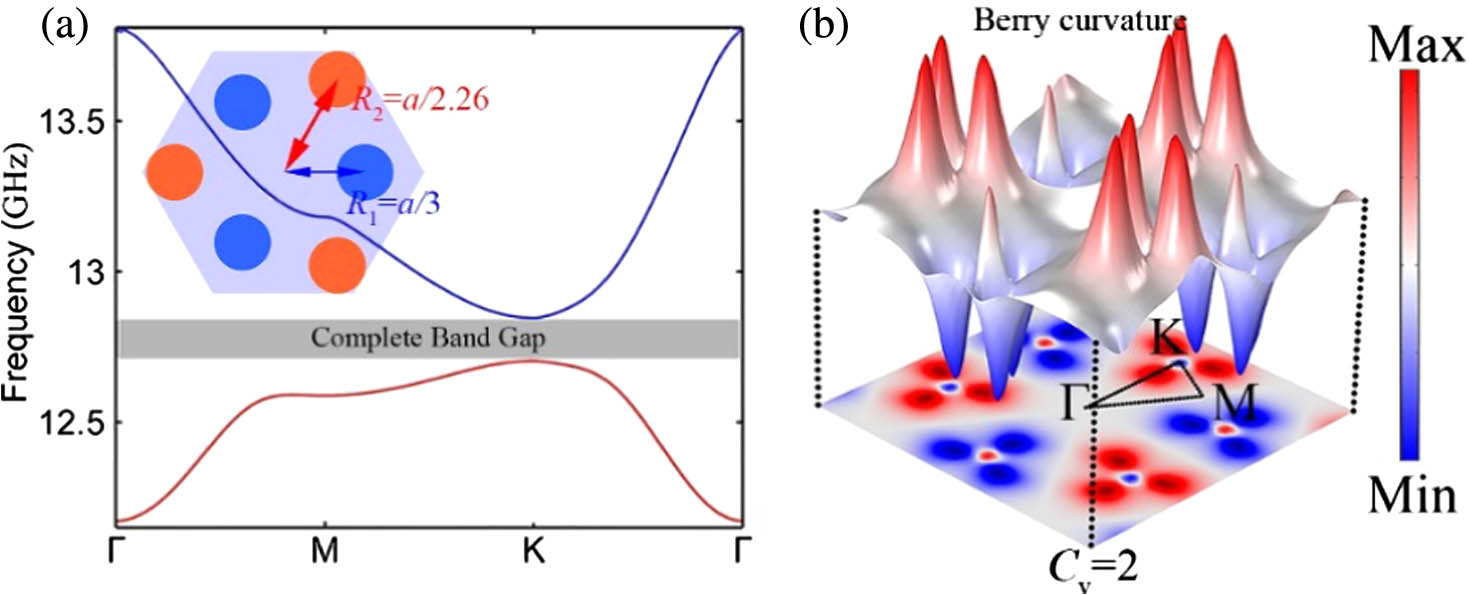
    Fig. 2. (a) Band structures of the PC at R1=a/3 and R2=a/2.26. (b) Berry curvature in the first Brillouin zone. Curvature is opposite around the K and K points, and the valley Chern number Cv=CkCk=1(1)=2.
    Topological edge state of valley Chern number Cv=2. (a) Projected band structures for the valley Chern difference |ΔCv|=2 at K(K′) point across the domain wall. Insets are the distributions of Ez at the given points A and B in the band structure. (b) Transmission spectra of Z-shape corners in the frequency range of 12.69–12.85 GHz. The red and yellow regions correspond to the single-mode and multimode regions, respectively. The insets are the Ez field distributions at the frequencies in the single-mode and multimode regions.
    Fig. 3. Topological edge state of valley Chern number Cv=2. (a) Projected band structures for the valley Chern difference |ΔCv|=2 at K(K) point across the domain wall. Insets are the distributions of Ez at the given points A and B in the band structure. (b) Transmission spectra of Z-shape corners in the frequency range of 12.69–12.85 GHz. The red and yellow regions correspond to the single-mode and multimode regions, respectively. The insets are the Ez field distributions at the frequencies in the single-mode and multimode regions.
    Band structures, phase and power flow distribution, and corresponding Berry curvature of the PC, where R1 is fixed at a/3, (a) R2=a/2.36 and valley Chern number Cv=−3, (b) R2=a/4.2 and Cv=3, and (c) R2=a/4.8 and Cv=1. Arrow inserted in the phase distribution indicates the Poynting vector.
    Fig. 4. Band structures, phase and power flow distribution, and corresponding Berry curvature of the PC, where R1 is fixed at a/3, (a) R2=a/2.36 and valley Chern number Cv=3, (b) R2=a/4.2 and Cv=3, and (c) R2=a/4.8 and Cv=1. Arrow inserted in the phase distribution indicates the Poynting vector.
    Electric field distribution in momentum space. (a) Chiral sources carry positive and negative OAM. Colors are the phase of electric field excited by the source in the center. Arrows show the direction of OAM: the counterclockwise arrow represents the positive OAM and the clockwise arrow represents the negative one. (b) Field excited by the chiral source with positive OAM, where the field is strongly localized at point K. (c) Field excited by the source with negative OAM, where the field is strongly localized at point K′. Panel insets are the close look near the point K or K′.
    Fig. 5. Electric field distribution in momentum space. (a) Chiral sources carry positive and negative OAM. Colors are the phase of electric field excited by the source in the center. Arrows show the direction of OAM: the counterclockwise arrow represents the positive OAM and the clockwise arrow represents the negative one. (b) Field excited by the chiral source with positive OAM, where the field is strongly localized at point K. (c) Field excited by the source with negative OAM, where the field is strongly localized at point K. Panel insets are the close look near the point K or K.
    Variation of the valley frequency with varying R2 when R1 is fixed. The valley Chern number Cv remains unchanged in the region of the same color.
    Fig. 6. Variation of the valley frequency with varying R2 when R1 is fixed. The valley Chern number Cv remains unchanged in the region of the same color.
    Topological edge state of valley Chern number of Cv=1 and 3. Panels (a) and (b) are the projected band structures for the valley Chern number difference across the domain wall, respectively, |ΔCv|=1 and 3 at K(K′) point. The number of edge states present in the bandgap is the same as the valley Chern number difference. The panel insets are the distributions of Ez at the given points in the band structure. The fields are all localized at the domain wall. (c) and (d) Transmission spectra of Z-shaped topological domain wall for valley Chern number difference |ΔCv|=1 and 3 at K(K′) point, respectively. Simulated Ez field distributions are inserted. The yellow curves represent the energy flows.
    Fig. 7. Topological edge state of valley Chern number of Cv=1 and 3. Panels (a) and (b) are the projected band structures for the valley Chern number difference across the domain wall, respectively, |ΔCv|=1 and 3 at K(K) point. The number of edge states present in the bandgap is the same as the valley Chern number difference. The panel insets are the distributions of Ez at the given points in the band structure. The fields are all localized at the domain wall. (c) and (d) Transmission spectra of Z-shaped topological domain wall for valley Chern number difference |ΔCv|=1 and 3 at K(K) point, respectively. Simulated Ez field distributions are inserted. The yellow curves represent the energy flows.
    Xiang Xi, Kang-Ping Ye, Rui-Xin Wu. Topological photonic crystal of large valley Chern numbers[J]. Photonics Research, 2020, 8(9): B1
    Download Citation