• High Power Laser Science and Engineering
  • Vol. 10, Issue 5, 05000e31 (2022)
I. Tazes1、2, S. Passalidis3, E. Kaselouris1、4, I. Fitilis1、2, M. Bakarezos1、4, N. A. Papadogiannis1、4, M. Tatarakis1、2, and V. Dimitriou1、4、*
Author Affiliations
  • 1Institute of Plasma Physics and Lasers - IPPL, Hellenic Mediterranean University Research Centre, Rethymnon, Greece
  • 2Department of Electronic Engineering, Hellenic Mediterranean University, Chania, Greece
  • 3CNRS, Laboratoire de Chimie Physique-Matière et Rayonnement, Sorbonne Université, Paris, France
  • 4Department of Music Technology and Acoustics, Hellenic Mediterranean University, Rethymnon, Greece
  • show less
    DOI: 10.1017/hpl.2022.16 Cite this Article Set citation alerts
    I. Tazes, S. Passalidis, E. Kaselouris, I. Fitilis, M. Bakarezos, N. A. Papadogiannis, M. Tatarakis, V. Dimitriou. A computational study on the optical shaping of gas targets via blast wave collisions for magnetic vortex acceleration[J]. High Power Laser Science and Engineering, 2022, 10(5): 05000e31 Copy Citation Text show less
    The H density distribution of a single BW at t = 0 ns (a) and at t = 3 ns (b).
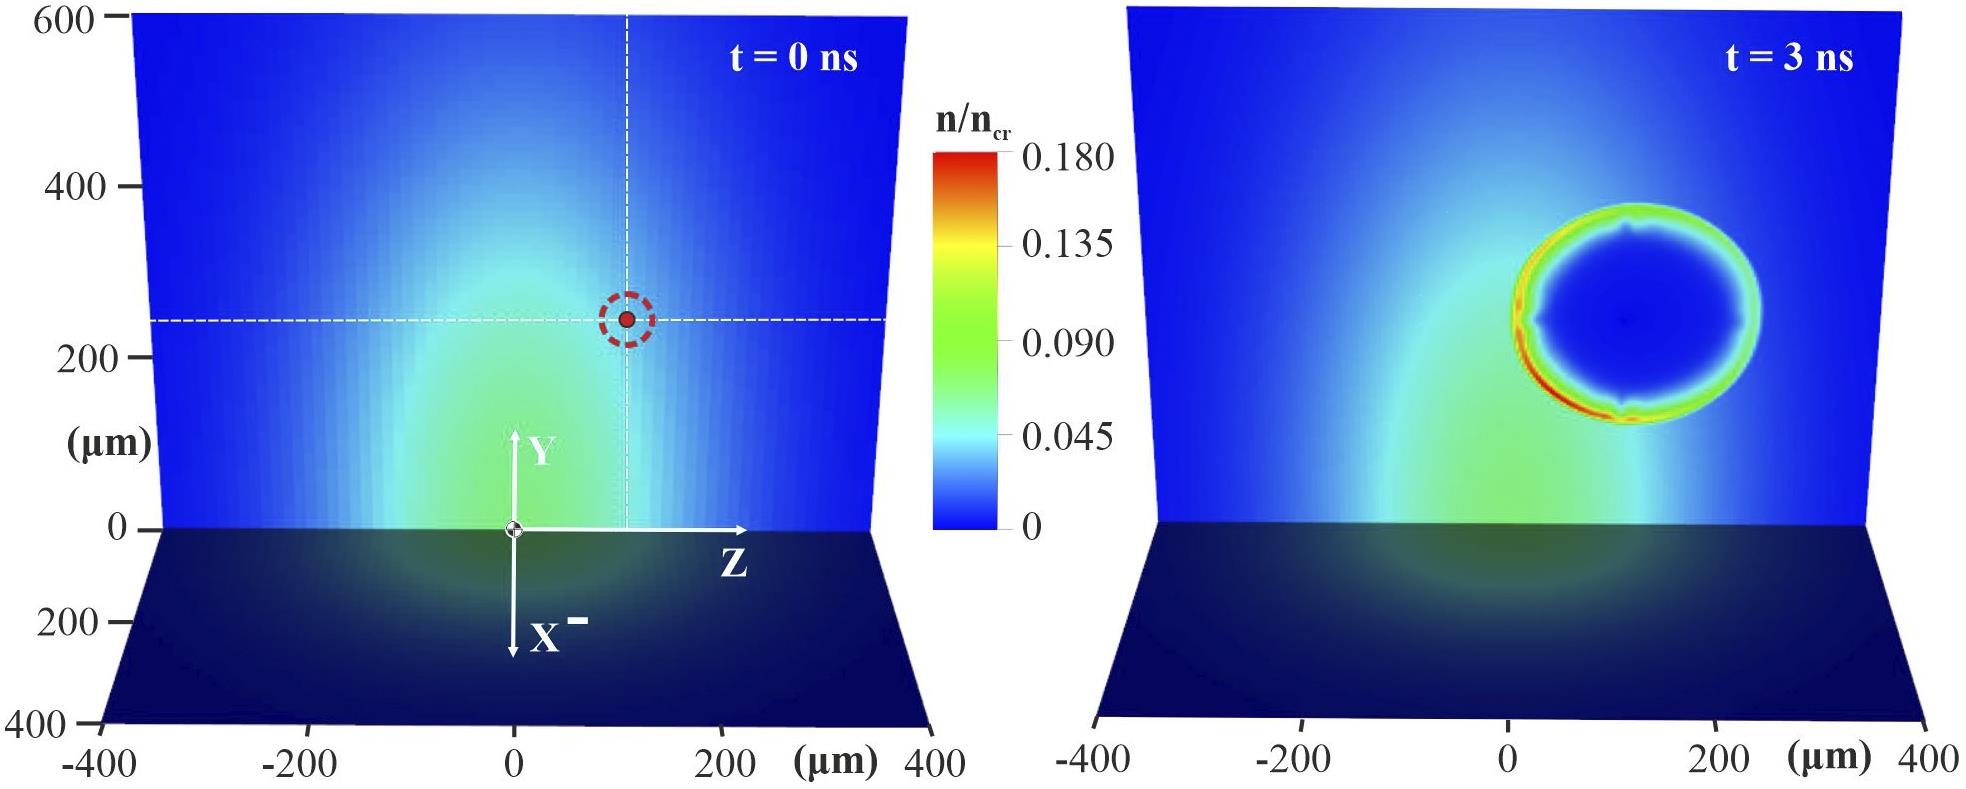
    Fig. 1. The H density distribution of a single BW at t = 0 ns (a) and at t = 3 ns (b).
    The H density profile lineouts of the focused beam at Y = 250 μm, Z = 100, 120 and 150 μm at t = 1.8, 3.1 and 4.9 ns, respectively, when the shock front reaches the centre of the gas-jet (a). Lineouts of the H density evolution at Y = 200 μm and Z = 120 μm, where the compression of the BW front is maximized at t = 1.6 ns (b).
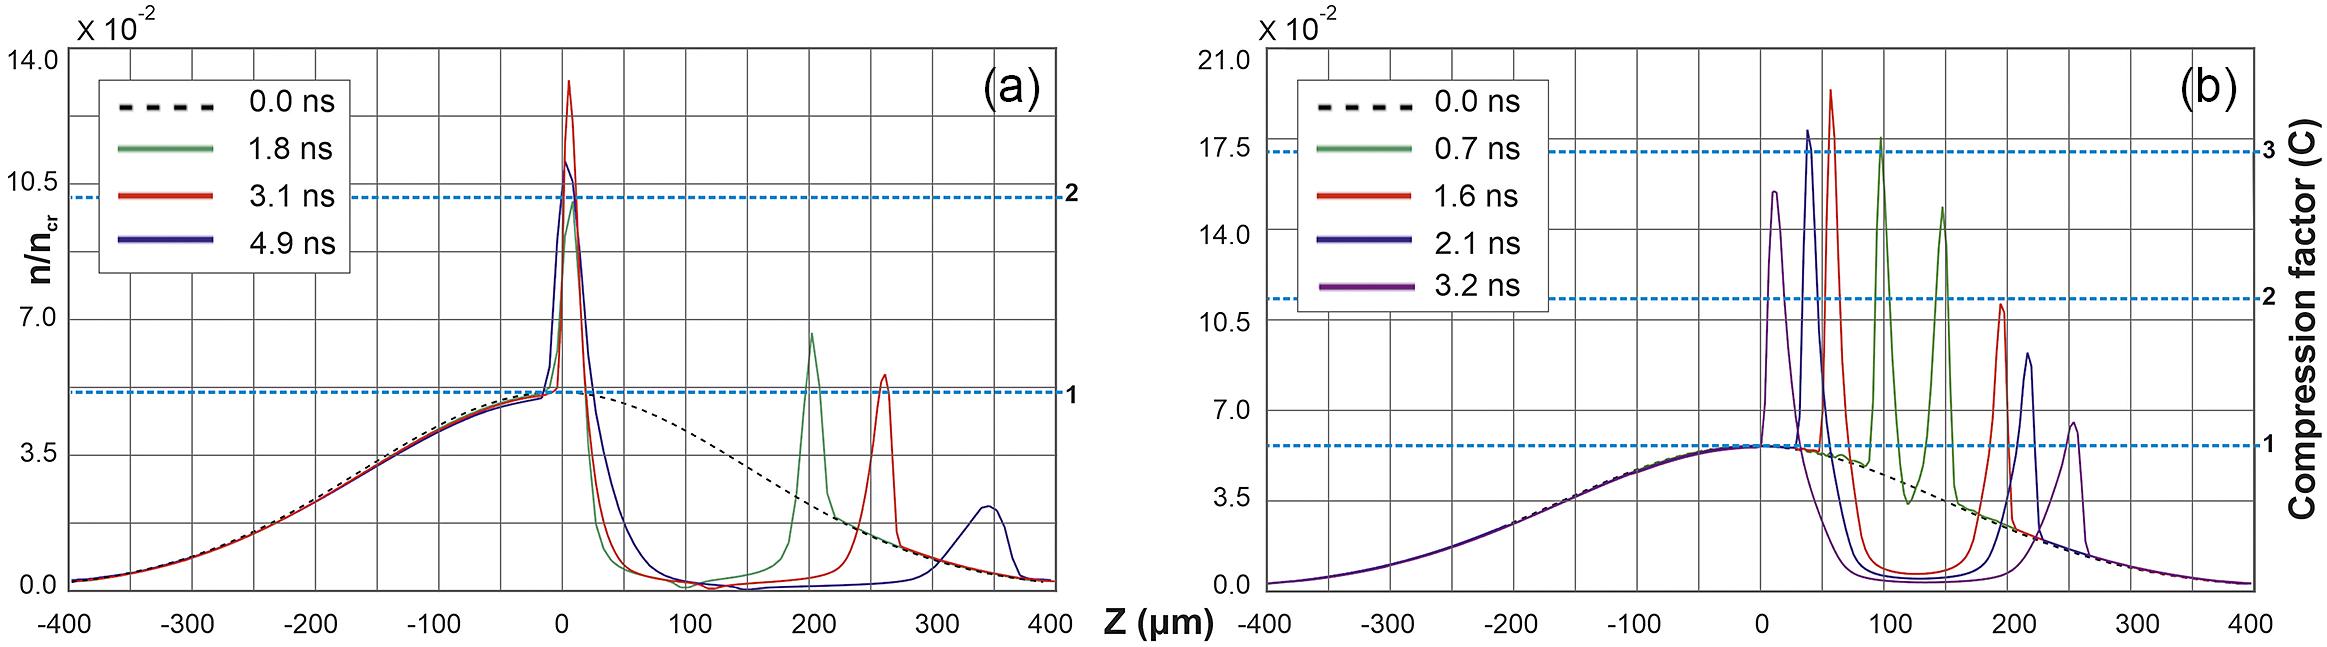
    Fig. 2. The H density profile lineouts of the focused beam at Y = 250 μm, Z = 100, 120 and 150 μm at t = 1.8, 3.1 and 4.9 ns, respectively, when the shock front reaches the centre of the gas-jet (a). Lineouts of the H density evolution at Y = 200 μm and Z = 120 μm, where the compression of the BW front is maximized at t = 1.6 ns (b).
    Temperatures of electrons Te and ions Ti at Y = 250 μm when t = 5.1 ps, 1.0 and 3.1 ns (a). Laser pulse energy density absorption rate by the H gas at the same times (b).
    Fig. 3. Temperatures of electrons Te and ions Ti at Y = 250 μm when t = 5.1 ps, 1.0 and 3.1 ns (a). Laser pulse energy density absorption rate by the H gas at the same times (b).
    Schematic representation of the two alternative setups, in 3D and a 2D section top-view, of the generation of the dual BWs with the two laser pulses delivered (a) in parallel and (b) by intersecting at an angle of 60o.
    Fig. 4. Schematic representation of the two alternative setups, in 3D and a 2D section top-view, of the generation of the dual BWs with the two laser pulses delivered (a) in parallel and (b) by intersecting at an angle of 60o.
    The H density profile lineouts of the focused beam at Y = 220 μm, Z = 120 μm at t = 0.8, 2.4 and 3.6 ns. The dashed-dotted magenta line corresponds to the single BW at t = 2.4 ns to emphasize the peak H density and propagation distance of the dual BWs compared to the single BW.
    Fig. 5. The H density profile lineouts of the focused beam at Y = 220 μm, Z = 120 μm at t = 0.8, 2.4 and 3.6 ns. The dashed-dotted magenta line corresponds to the single BW at t = 2.4 ns to emphasize the peak H density and propagation distance of the dual BWs compared to the single BW.
    The ionization degree at Y = 220 μm, where the maximum compression is indicated (a) and the electron temperatures at the focal spots at Y = 250 μm (b).
    Fig. 6. The ionization degree at Y = 220 μm, where the maximum compression is indicated (a) and the electron temperatures at the focal spots at Y = 250 μm (b).
    (a) Lineouts of the compression factor along the Z-axis at Y = 200 μm. The maximum compression is indicated for t = 0.6, 1.3, 2.1 ns. (b) Lineouts of the compression factor along the X-axis at various times from 0 to 4.3 ns.
    Fig. 7. (a) Lineouts of the compression factor along the Z-axis at Y = 200 μm. The maximum compression is indicated for t = 0.6, 1.3, 2.1 ns. (b) Lineouts of the compression factor along the X-axis at various times from 0 to 4.3 ns.
    The H density n/ncr of the optically shaped targets, referencing the two alternative setups presented in Figure 4, on the 2D planes YX, ZX and ZY, with the two laser pulses (a) delivered in parallel and (b) by intersecting at an angle of 60o.
    Fig. 8. The H density n/ncr of the optically shaped targets, referencing the two alternative setups presented in Figure 4, on the 2D planes YX, ZX and ZY, with the two laser pulses (a) delivered in parallel and (b) by intersecting at an angle of 60o.
    3D schematic representation of the two alternative setups for the generation of the triple BWs with the three laser pulses delivered in parallel (a) and by intersecting (b).
    Fig. 9. 3D schematic representation of the two alternative setups for the generation of the triple BWs with the three laser pulses delivered in parallel (a) and by intersecting (b).
    H density lineouts along the Z-axis at t = 1.4, 3.2 and 5.1 ns at Y = 325 μm (a). Isosurface contour plot of the triple parallel laser pulses shaped, BW collision (b) and the H density distribution on the XY, Z = 0 plane (c).
    Fig. 10. H density lineouts along the Z-axis at t = 1.4, 3.2 and 5.1 ns at Y = 325 μm (a). Isosurface contour plot of the triple parallel laser pulses shaped, BW collision (b) and the H density distribution on the XY, Z = 0 plane (c).
    H density lineouts along the Z-axis at t = 1.1, 2.4 and 3.4 ns at Y = 275 μm (a). Isosurface contour plot of the triple intersecting laser pulses shaped, BW collision (b) and the H density distribution on the XY, Z = 0 plane (c).
    Fig. 11. H density lineouts along the Z-axis at t = 1.1, 2.4 and 3.4 ns at Y = 275 μm (a). Isosurface contour plot of the triple intersecting laser pulses shaped, BW collision (b) and the H density distribution on the XY, Z = 0 plane (c).
    Schematic representation of the two alternative setups for the generation of the quadruple BWs, with the four laser pulses delivered in parallel (a) and perpendicularly, in pairs (b).
    Fig. 12. Schematic representation of the two alternative setups for the generation of the quadruple BWs, with the four laser pulses delivered in parallel (a) and perpendicularly, in pairs (b).
    H density lineouts along the Z-axis at t = 5.1, 6.4 and 7.6 ns at Y = 390 μm (a). Isosurface contour plot of the quadruple parallel in pairs of laser pulses shaped, BW collision (b) and the H density distribution on the XY, Z = 0 plane (c).
    Fig. 13. H density lineouts along the Z-axis at t = 5.1, 6.4 and 7.6 ns at Y = 390 μm (a). Isosurface contour plot of the quadruple parallel in pairs of laser pulses shaped, BW collision (b) and the H density distribution on the XY, Z = 0 plane (c).
    H density lineouts along the X–Z diagonal at t = 1.3, 2.6 and 4.2 ns at Y = 270 μm (a). Isosurface contour plot of the quadruple perpendicularly intersecting in pairs of laser pulses shaped, BW collision with a zoomed detail of the transverse profile (b) and the H density distribution on the XY, Z = 0 plane (c).
    Fig. 14. H density lineouts along the XZ diagonal at t = 1.3, 2.6 and 4.2 ns at Y = 270 μm (a). Isosurface contour plot of the quadruple perpendicularly intersecting in pairs of laser pulses shaped, BW collision with a zoomed detail of the transverse profile (b) and the H density distribution on the XY, Z = 0 plane (c).
    The compression factor C (a) and the compression ratio n/(n–1) (b) of the two alternative setups simulated in relation to the number of BWs.
    Fig. 15. The compression factor C (a) and the compression ratio n/(n–1) (b) of the two alternative setups simulated in relation to the number of BWs.
    Ionized H+ density (nH+/ ncr) results of the MVA. The main pulse of ZEUS interacts with the quadruple perpendicularly intersecting laser pulse BWs, shaped profile: (a) left view (XY, Z = –20 μm), at t = 600 fs; (b) isometric and front view (ZY, X = 80 μm), at t = 600 fs; (c) H+ and electron energy spectra, where the cut-off proton kinetic energy is approximately 16.5 MeV, at t = 600 fs. (d) Temporal evolution of the azimuthal magnetic field Bz of the vortex at t = 200, 250 and 300 fs.
    Fig. 16. Ionized H+ density (nH+/ ncr) results of the MVA. The main pulse of ZEUS interacts with the quadruple perpendicularly intersecting laser pulse BWs, shaped profile: (a) left view (XY, Z = –20 μm), at t = 600 fs; (b) isometric and front view (ZY, X = 80 μm), at t = 600 fs; (c) H+ and electron energy spectra, where the cut-off proton kinetic energy is approximately 16.5 MeV, at t = 600 fs. (d) Temporal evolution of the azimuthal magnetic field Bz of the vortex at t = 200, 250 and 300 fs.
    I. Tazes, S. Passalidis, E. Kaselouris, I. Fitilis, M. Bakarezos, N. A. Papadogiannis, M. Tatarakis, V. Dimitriou. A computational study on the optical shaping of gas targets via blast wave collisions for magnetic vortex acceleration[J]. High Power Laser Science and Engineering, 2022, 10(5): 05000e31
    Download Citation