• Acta Photonica Sinica
  • Vol. 50, Issue 2, 122 (2021)
Guolin LI, Qingzhi JIANG, Kun MA, Yue JIAO, and Wenhai JI
Author Affiliations
  • College of Control Science and Engineering, China University of Petroleum (East China), Qingdao, Shandong266580, China
  • show less
    DOI: 10.3788/gzxb20215002.0212001 Cite this Article
    Guolin LI, Qingzhi JIANG, Kun MA, Yue JIAO, Wenhai JI. Experimental Study on Methane Detection Based on Cascaded Integrator Comb of Digital Orthogonal Phase-locked in Amplifier[J]. Acta Photonica Sinica, 2021, 50(2): 122 Copy Citation Text show less
    The absorption spectrum of CH4, CO2, and H2O in the vicinity of 1 653 nm
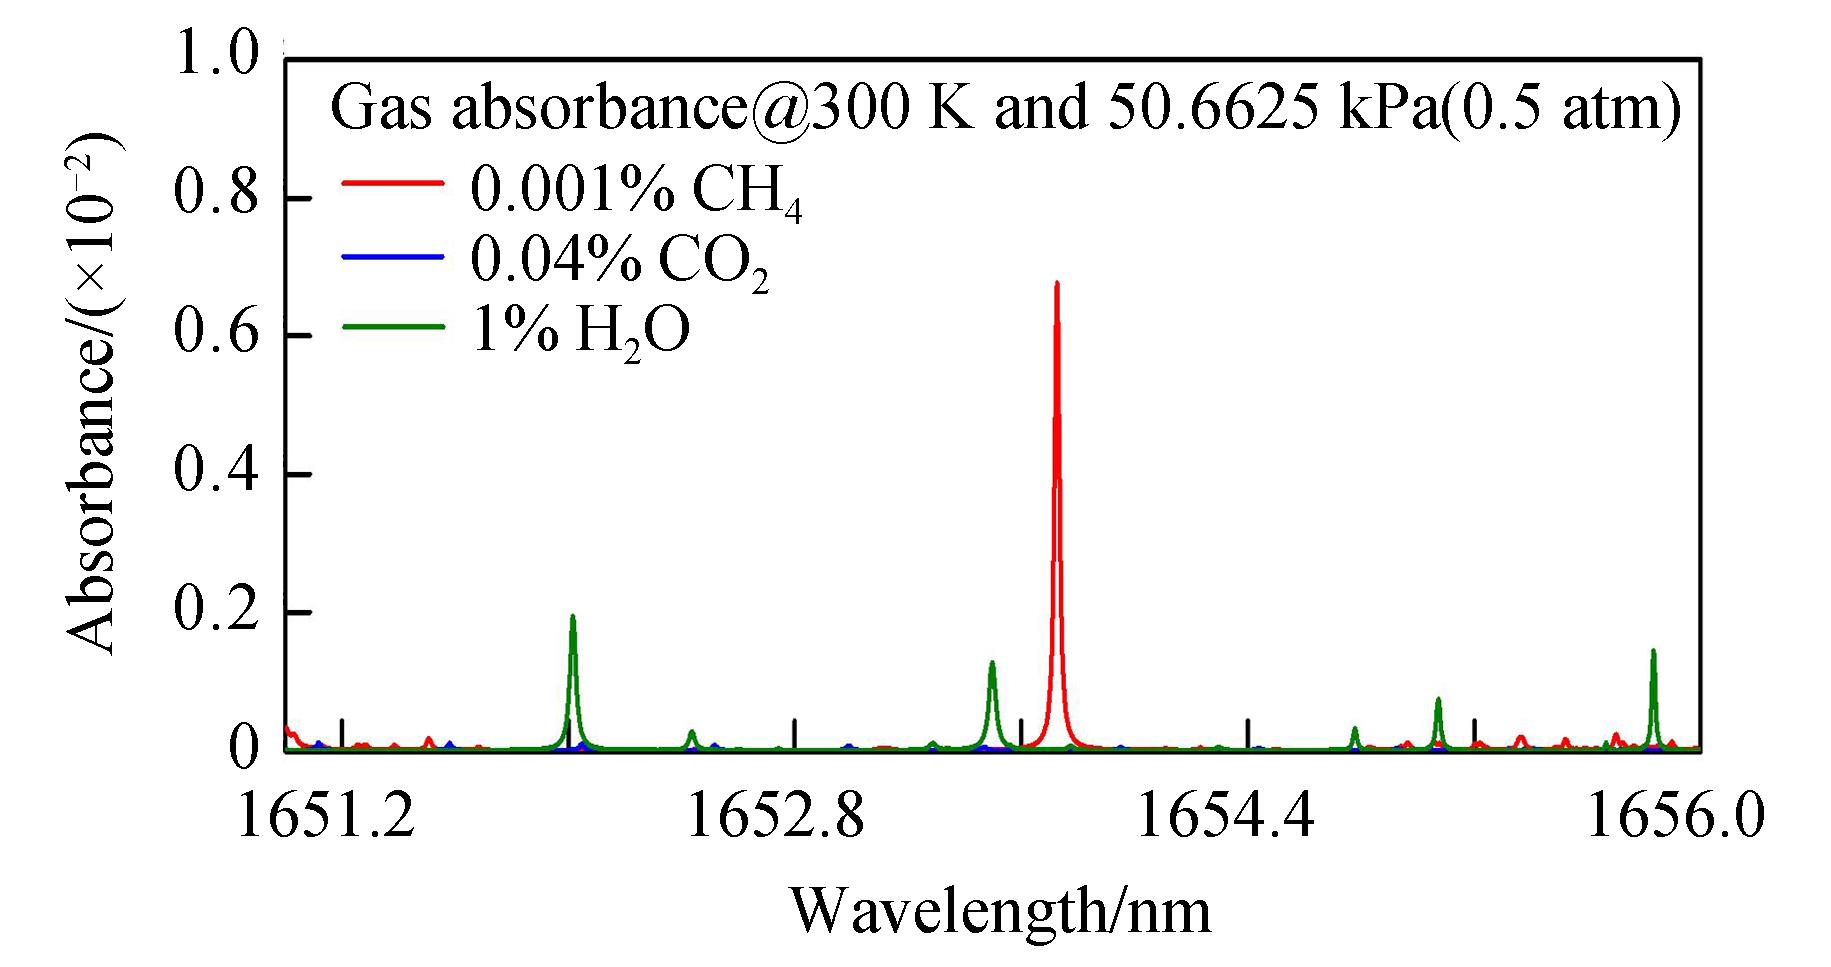
    Fig. 1. The absorption spectrum of CH4, CO2, and H2O in the vicinity of 1 653 nm
    Experimental system installation diagram
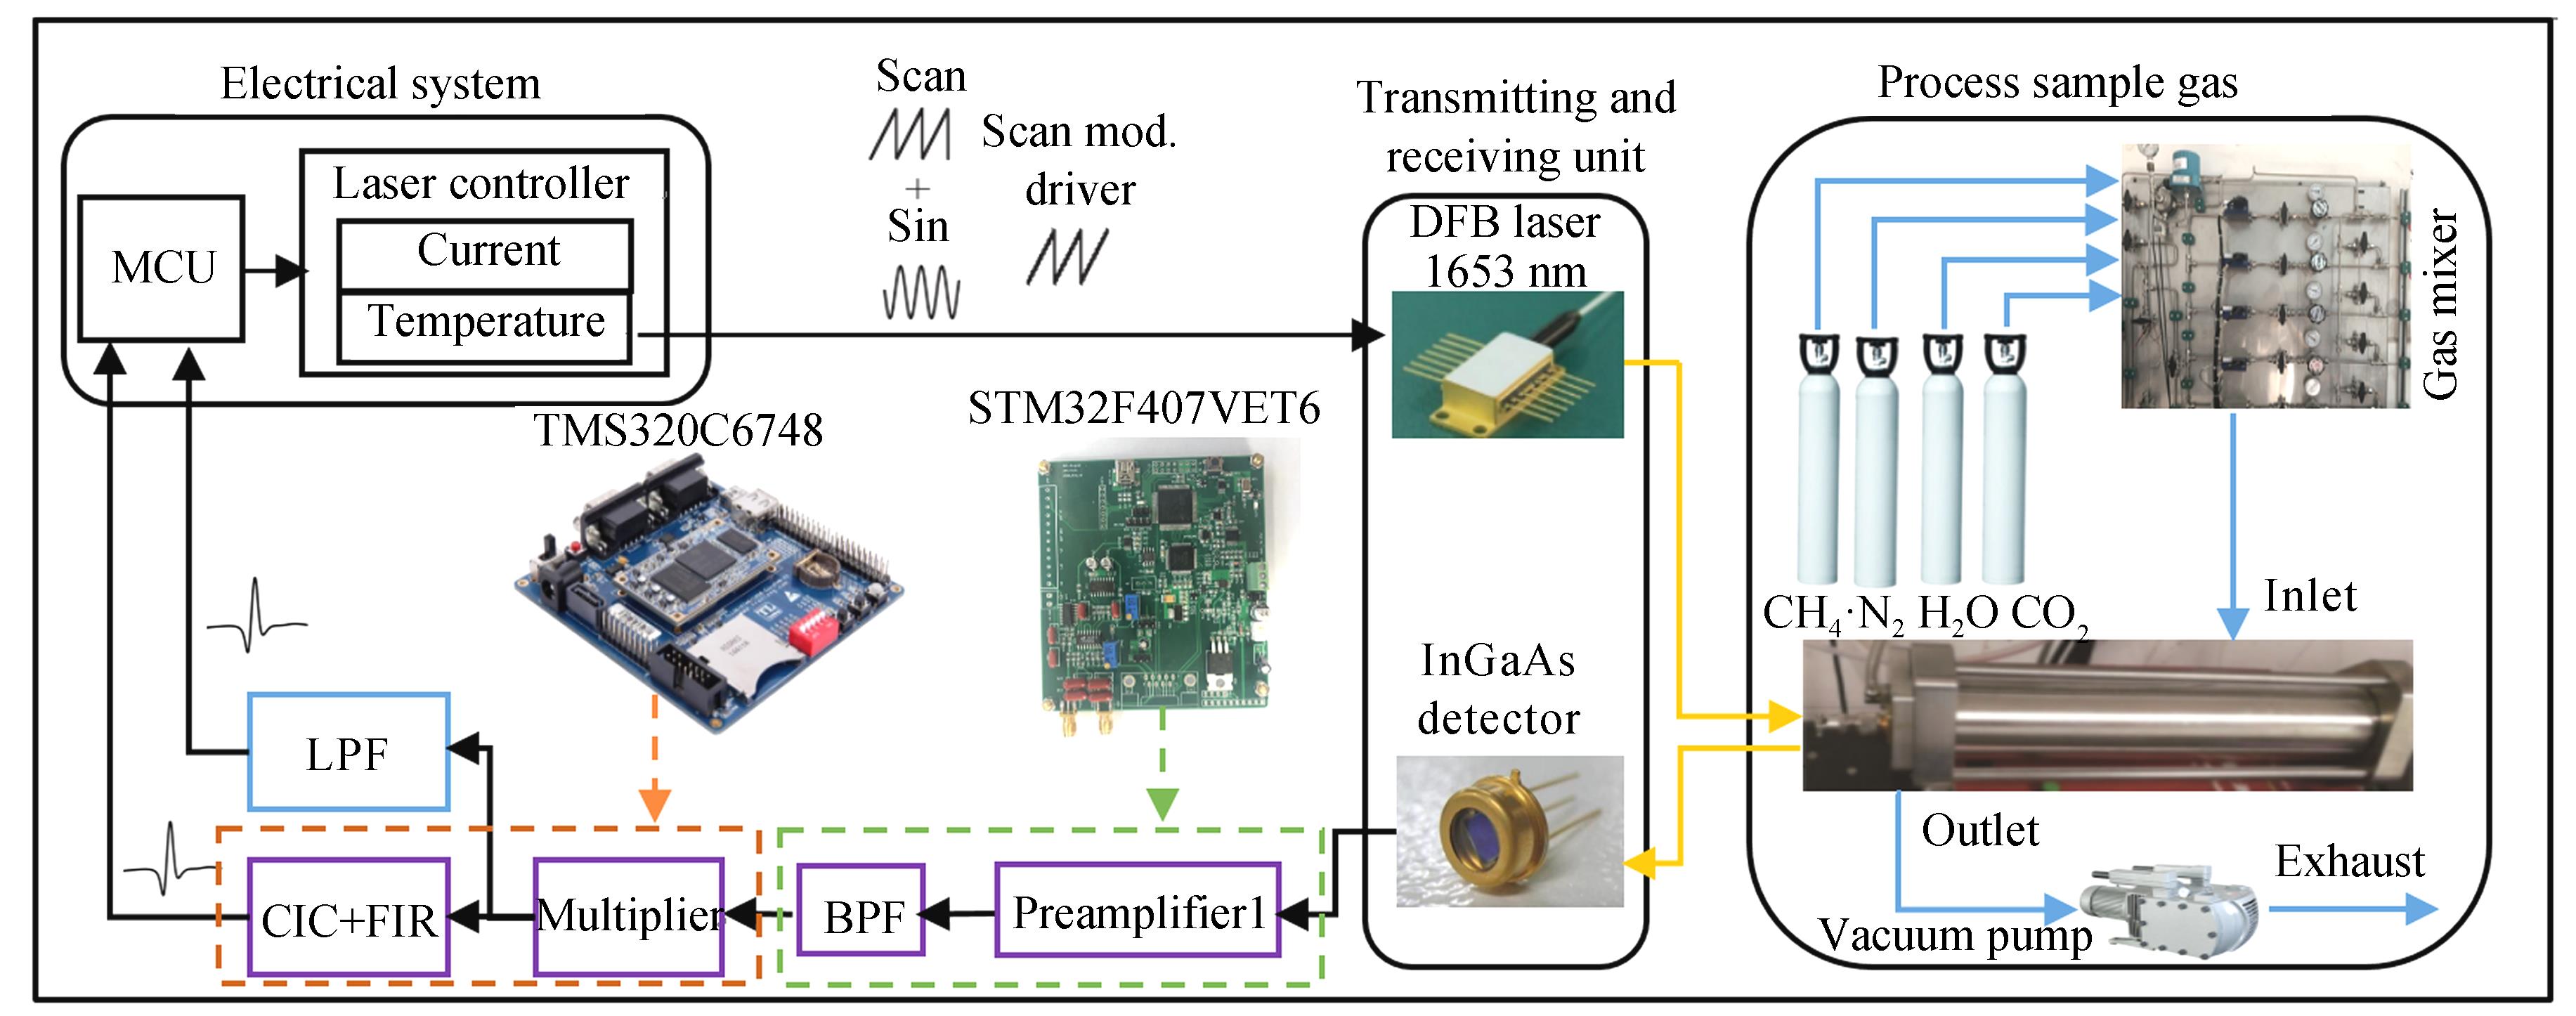
    Fig. 2. Experimental system installation diagram
    The relationship diagram of laser emission wavelength, current tuning and temperature tuning
    Fig. 3. The relationship diagram of laser emission wavelength, current tuning and temperature tuning
    Quadrature lock-in amplifier working principle diagram
    Fig. 4. Quadrature lock-in amplifier working principle diagram
    Digital quadrature lock-in amplifier input and output signal simulation diagram
    Fig. 5. Digital quadrature lock-in amplifier input and output signal simulation diagram
    The structure diagram design of narrow-band low-pass filter
    Fig. 6. The structure diagram design of narrow-band low-pass filter
    Simulation diagram of laser drive signal and analog gas absorption signal
    Fig. 7. Simulation diagram of laser drive signal and analog gas absorption signal
    Simulation diagram of TDLAS-WMS system based on digital quadrature lock-in amplifier
    Fig. 8. Simulation diagram of TDLAS-WMS system based on digital quadrature lock-in amplifier
    Second harmonic signal simulation diagram and fitting result diagram
    Fig. 9. Second harmonic signal simulation diagram and fitting result diagram
    Output diagram of the second harmonic signal of CIC filter and LPF filter
    Fig. 10. Output diagram of the second harmonic signal of CIC filter and LPF filter
    The relationship between the concentration inversion value and the set value of the TDLAS system based on CIC and LPF
    Fig. 11. The relationship between the concentration inversion value and the set value of the TDLAS system based on CIC and LPF
    Experimental detection results of methane gas with concentration of 1~100 ppm
    Fig. 12. Experimental detection results of methane gas with concentration of 1~100 ppm
    Concentration inversion effect diagram of NIPALS-ELM and CLS algorithm models
    Fig. 13. Concentration inversion effect diagram of NIPALS-ELM and CLS algorithm models
    Stability test result graph and Allan analysis of variance graph
    Fig. 14. Stability test result graph and Allan analysis of variance graph
    Set value/ppm4.005.0010.0020.0030.0040.0050.0060.0070.0080.0090.00100.00
    CLS-test value/ppm4.435.9315.1422.3731.1140.2451.2861.0271.0179.2486.7599.67
    NIPALS-ELM-test value/ppm4.105.0312.6920.3130.2140.0249.8359.4669.7079.4988.85100.29
    CLS-error/ppm0.430.935.142.371.110.241.281.021.01-0.76-3.25-0.33
    NIPALS-ELM-error/ppm0.100.032.690.310.210.02-0.17-0.54-0.30-0.51-1.150.29
    Table 1. Comparison of concentration retrieving error between NIPALS-ELM and CLS algorithm models
    Guolin LI, Qingzhi JIANG, Kun MA, Yue JIAO, Wenhai JI. Experimental Study on Methane Detection Based on Cascaded Integrator Comb of Digital Orthogonal Phase-locked in Amplifier[J]. Acta Photonica Sinica, 2021, 50(2): 122
    Download Citation