
Xin WANG, Zhe-ming KANG, Long LIU, Xian-guang FAN. Multi-channel Raman Spectral Reconstruction Based on Gaussian Kernel Principal Component Analysis[J]. Acta Photonica Sinica, 2020, 49(3): 0330001
- Acta Photonica Sinica
- Vol. 49, Issue 3, 0330001 (2020)
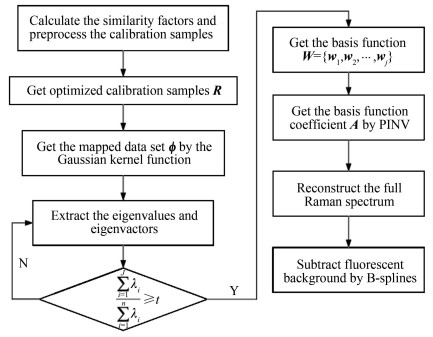
Fig. 1. Process of Raman spectral reconstruction algorithm based on KPCA

Fig. 2. The calibration Raman spectra of PMMA measured by different integration times and sample preparation methods
Fig. 3. The Raman spectrum of PMMA with random fluorescence background and noise and the Raman spectrum of PMMA without fluorescence background and noise
Fig. 4. Full reconstructed Raman spectra based on PINV, Wiener estimation, PCA and KPCA, respectively
Fig. 5. Multi-channel narrow-band image
Fig. 6. The Raman images reconstructed by PINV, Wiener estimation and KPCA, respectively
Fig. 7. Full Raman spectra based on pixel 1 and 2 reconstructed by PINV, Wiener estimation and KPCA, respectively
|
Table 1. The calibration Raman spectra of PMMA measured by different integration times and sample preparation methods
|
Table 2. RMSEs offull reconstructed Raman spectra based on PINV, wiener estimation, PCA and KPCA
|
Table 3. RMSEs of full reconstructed Raman spectra based on PINV, wiener estimation, PCA and KPCA under conditions of different noise
|
Table 4. RMSEs of full Raman spectra based on pixel 1 and pixel 2 reconstructed by PINV, Wiener estimation and KPCA, respectively

Set citation alerts for the article
Please enter your email address
© Copyright 2018-2021 | Chinese Laser Press. All Rights Reserved 沪ICP备15018463号-20